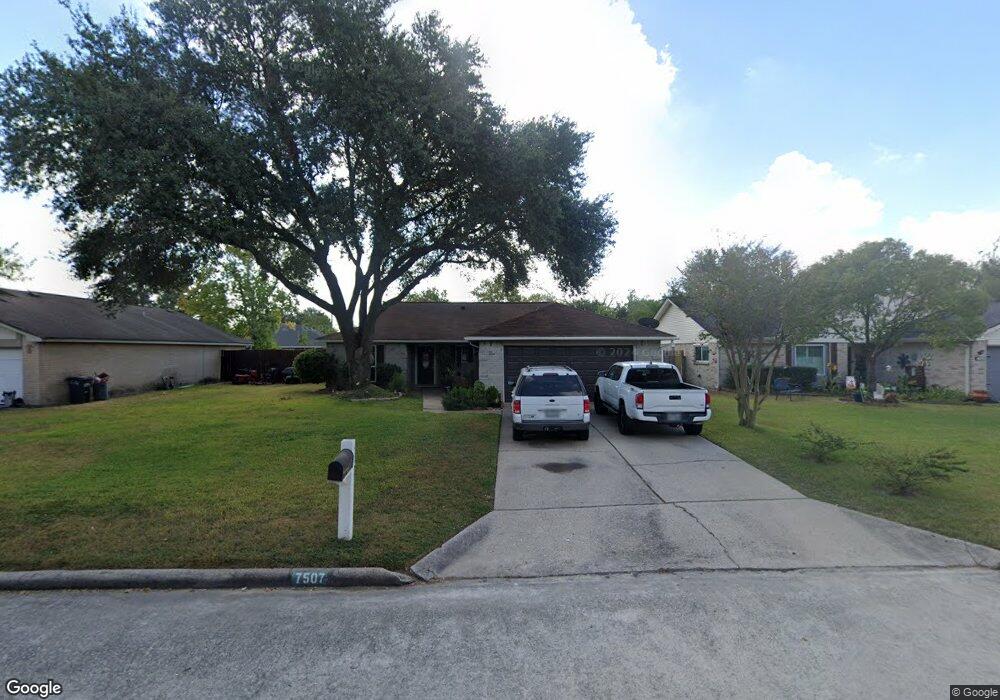
7507 Fur Market Dr Houston, TX 77064
North Houston NeighborhoodEstimated Value: $204,000 - $223,000
3
Beds
2
Baths
1,346
Sq Ft
$159/Sq Ft
Est. Value
About This Home
This home is located at 7507 Fur Market Dr, Houston, TX 77064 and is currently estimated at $214,428, approximately $159 per square foot. 7507 Fur Market Dr is a home located in Harris County with nearby schools including Frazier Elementary School, Cook Middle School, and Jersey Village High School.
Ownership History
Date
Name
Owned For
Owner Type
Purchase Details
Closed on
May 7, 2004
Sold by
Wemola Homes Llc
Bought by
Prieto Jose A
Current Estimated Value
Home Financials for this Owner
Home Financials are based on the most recent Mortgage that was taken out on this home.
Original Mortgage
$92,635
Outstanding Balance
$43,066
Interest Rate
5.38%
Mortgage Type
Purchase Money Mortgage
Estimated Equity
$171,362
Purchase Details
Closed on
Mar 12, 2004
Sold by
Gullo Carol Elaine
Bought by
Wemola Homes Llc
Home Financials for this Owner
Home Financials are based on the most recent Mortgage that was taken out on this home.
Original Mortgage
$92,635
Outstanding Balance
$43,066
Interest Rate
5.38%
Mortgage Type
Purchase Money Mortgage
Estimated Equity
$171,362
Create a Home Valuation Report for This Property
The Home Valuation Report is an in-depth analysis detailing your home's value as well as a comparison with similar homes in the area
Home Values in the Area
Average Home Value in this Area
Purchase History
| Date | Buyer | Sale Price | Title Company |
|---|---|---|---|
| Prieto Jose A | -- | Texas American Title Company | |
| Wemola Homes Llc | -- | Texas American Title Company |
Source: Public Records
Mortgage History
| Date | Status | Borrower | Loan Amount |
|---|---|---|---|
| Open | Prieto Jose A | $92,635 | |
| Previous Owner | Wemola Homes Llc | $66,900 |
Source: Public Records
Tax History Compared to Growth
Tax History
| Year | Tax Paid | Tax Assessment Tax Assessment Total Assessment is a certain percentage of the fair market value that is determined by local assessors to be the total taxable value of land and additions on the property. | Land | Improvement |
|---|---|---|---|---|
| 2025 | $1,656 | $181,727 | $50,232 | $131,495 |
| 2024 | $1,656 | $185,372 | $50,232 | $135,140 |
| 2023 | $1,656 | $199,128 | $50,232 | $148,896 |
| 2022 | $3,702 | $168,941 | $35,880 | $133,061 |
| 2021 | $3,665 | $146,696 | $35,880 | $110,816 |
| 2020 | $3,471 | $135,420 | $29,952 | $105,468 |
| 2019 | $3,252 | $118,000 | $20,592 | $97,408 |
| 2018 | $902 | $118,000 | $20,592 | $97,408 |
| 2017 | $2,764 | $120,371 | $20,592 | $99,779 |
| 2016 | $2,513 | $101,864 | $17,160 | $84,704 |
| 2015 | $1,102 | $100,719 | $17,160 | $83,559 |
| 2014 | $1,102 | $81,451 | $12,168 | $69,283 |
Source: Public Records
Map
Nearby Homes
- 7535 Roaring Springs Dr
- 8326 Sorrel Dr
- 7615 Fur Market Dr
- 8406 Daycoach Ln
- 7727 Westbank Ave
- 5715 & 5721 Spindle Dr
- 5624 Spindle Dr
- 7122 Breen Dr
- 7706 Cloverlake Ct
- 10515 Ince Ln
- 7926 Westington Ln
- 7911 Bova Rd
- 7671 Bubbling Spring Ln
- 6902 Breen Dr
- 7510 Bubbling Spring Ln
- 7602 Smiling Wood Ln
- 7650 Smiling Wood Ln
- 8115 Oahu Ct
- 6713 Breen Dr
- 7410 Log Hollow Dr
- 7511 Fur Market Dr
- 7503 Fur Market Dr
- 8331 Big Creek Dr
- 8335 Big Creek Dr
- 7515 Fur Market Dr
- 8327 Big Creek Dr
- 7506 Fur Market Dr
- 7510 Fur Market Dr
- 7519 Fur Market Dr
- 7502 Fur Market Dr
- 7514 Fur Market Dr
- 8338 Blacksmith Dr
- 8334 Blacksmith Dr
- 8342 Blacksmith Dr
- 7518 Fur Market Dr
- 8323 Blacksmith Dr
- 7523 Fur Market Dr
- 8330 Blacksmith Dr
- 8319 Big Creek Dr
- 8346 Blacksmith Dr