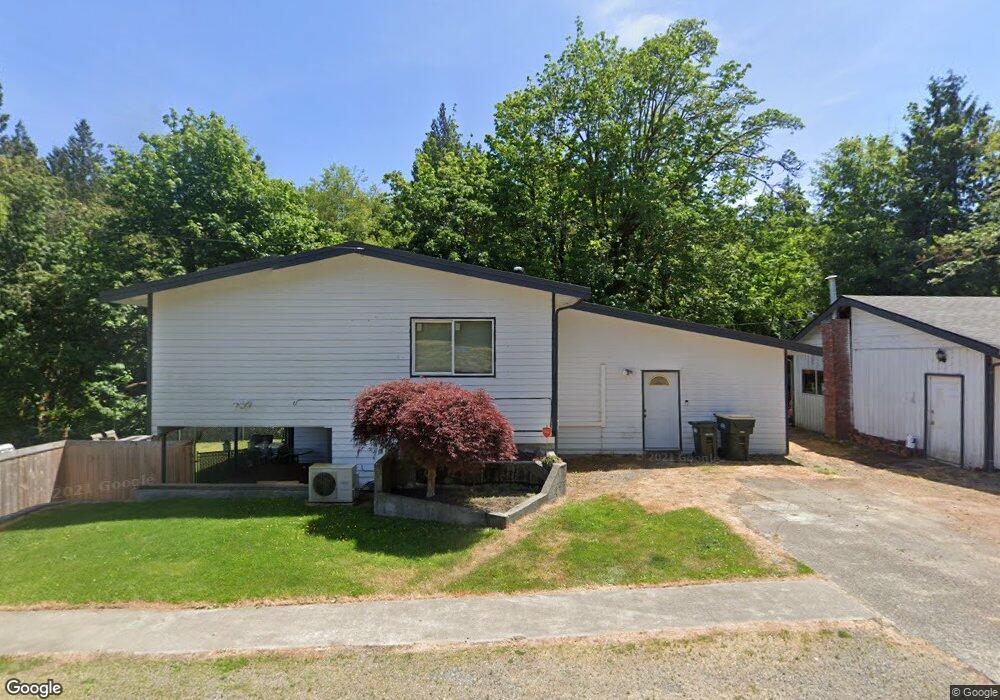
7508 Byron St NE Olympia, WA 98506
Estimated Value: $683,931 - $851,000
4
Beds
2
Baths
2,046
Sq Ft
$364/Sq Ft
Est. Value
About This Home
This home is located at 7508 Byron St NE, Olympia, WA 98506 and is currently estimated at $745,233, approximately $364 per square foot. 7508 Byron St NE is a home located in Thurston County with nearby schools including Boston Harbor Elementary School, Reeves Middle School, and Avanti High School.
Ownership History
Date
Name
Owned For
Owner Type
Purchase Details
Closed on
Apr 16, 2012
Sold by
Evans Ryan J
Bought by
James Larissa M
Current Estimated Value
Home Financials for this Owner
Home Financials are based on the most recent Mortgage that was taken out on this home.
Original Mortgage
$272,902
Outstanding Balance
$191,492
Interest Rate
4.25%
Mortgage Type
FHA
Estimated Equity
$553,741
Purchase Details
Closed on
Jul 14, 2009
Sold by
Federal National Mortgage Association
Bought by
Evans Ryan
Home Financials for this Owner
Home Financials are based on the most recent Mortgage that was taken out on this home.
Original Mortgage
$221,296
Interest Rate
5.37%
Mortgage Type
FHA
Purchase Details
Closed on
Nov 24, 2008
Sold by
Costello Daniel and Costello Bernadine M
Bought by
Federal National Mortgage Association
Create a Home Valuation Report for This Property
The Home Valuation Report is an in-depth analysis detailing your home's value as well as a comparison with similar homes in the area
Home Values in the Area
Average Home Value in this Area
Purchase History
| Date | Buyer | Sale Price | Title Company |
|---|---|---|---|
| James Larissa M | $280,000 | Stewart Title Company | |
| Evans Ryan | $150,000 | Chicago Title Company | |
| Federal National Mortgage Association | $425,840 | Chicago Title Company |
Source: Public Records
Mortgage History
| Date | Status | Borrower | Loan Amount |
|---|---|---|---|
| Open | James Larissa M | $272,902 | |
| Previous Owner | Evans Ryan | $221,296 |
Source: Public Records
Tax History Compared to Growth
Tax History
| Year | Tax Paid | Tax Assessment Tax Assessment Total Assessment is a certain percentage of the fair market value that is determined by local assessors to be the total taxable value of land and additions on the property. | Land | Improvement |
|---|---|---|---|---|
| 2024 | $5,389 | $534,300 | $225,300 | $309,000 |
| 2023 | $5,389 | $518,200 | $196,200 | $322,000 |
| 2022 | $4,919 | $513,700 | $172,100 | $341,600 |
| 2021 | $4,390 | $423,300 | $158,000 | $265,300 |
| 2020 | $3,824 | $345,600 | $99,700 | $245,900 |
| 2019 | $3,592 | $292,400 | $104,300 | $188,100 |
| 2018 | $3,756 | $284,600 | $80,000 | $204,600 |
| 2017 | $3,536 | $275,500 | $85,700 | $189,800 |
| 2016 | $3,226 | $250,800 | $71,100 | $179,700 |
| 2014 | -- | $241,800 | $71,100 | $170,700 |
Source: Public Records
Map
Nearby Homes
- 7601 Earling St NE
- 0 Xxx 73rd Ave NE Unit NWM2422126
- 403 Bromley Ln NE
- 6426 Zangle Rd NE
- 6600 Klein St NW
- 2520 70th Ave NW Unit 1
- 615 E Dana Dr
- 8305 Schirm Rd NW
- 6615 Cooper Point Rd NW
- 6753 Bellevista Place NW
- 2151 Beverly Beach Dr NW
- 2141 Beverly Beach Dr NW
- 2446 64th Ave NW
- 9044 Hunter Point Rd NW
- 5432 Boston Harbor Rd NE
- 2731 Fishtrap Loop NE
- 5504 Heights Ln NE
- 9504 Maple Beach Ln NW
- 8208 Steamboat Island Rd NW
- 2611 62nd Ave NW
- 7440 Byron St NE
- 7520 Byron St NE
- 649 75th Way NE
- 7441 Byron St NE
- 7434 Byron St NE
- 639 75th Way NE
- 812 73rd Ave NE
- 625 75th Way NE
- 626 75th Way NE
- 601 75th Way NE
- 7433 Byron St NE
- 7410 Byron St NE
- 611 75th Way NE
- 7409 Byron St NE
- 7419 Byron St NE
- 835 76th Ave NE
- 815 76th Ave NE
- 605 75th Way NE
- 7346 Byron St NE
- 0 Earling St NE