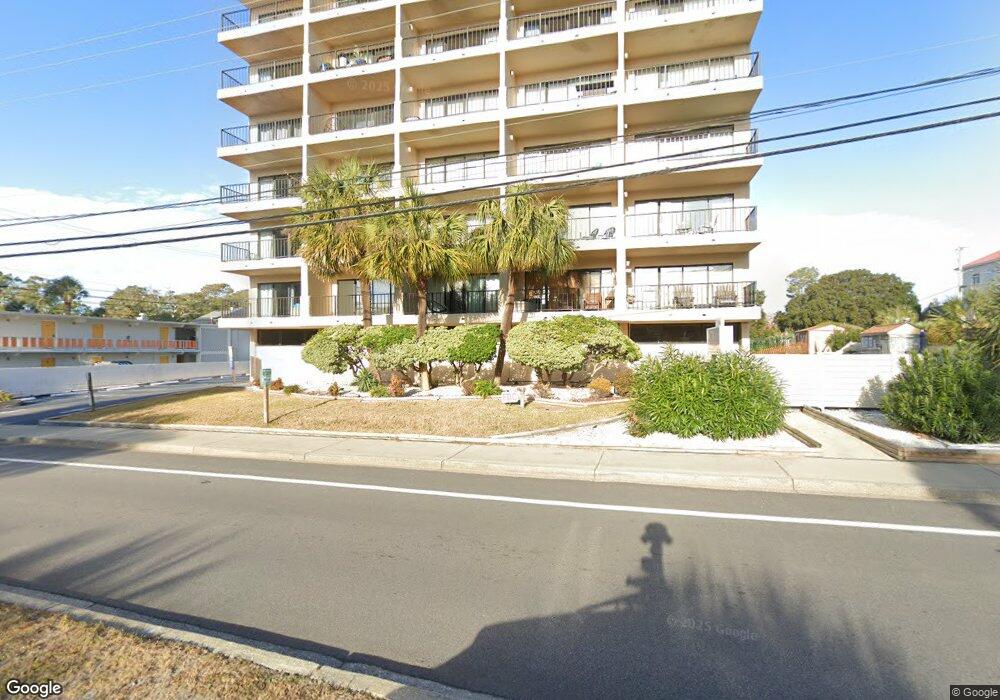
7509 N Ocean Blvd Unit 102 Ocean Villas Myrtle Beach, SC 29572
Grande Dunes NeighborhoodEstimated Value: $139,089 - $185,000
1
Bed
1
Bath
630
Sq Ft
$262/Sq Ft
Est. Value
About This Home
This home is located at 7509 N Ocean Blvd Unit 102 Ocean Villas, Myrtle Beach, SC 29572 and is currently estimated at $165,272, approximately $262 per square foot. 7509 N Ocean Blvd Unit 102 Ocean Villas is a home located in Horry County with nearby schools including Myrtle Beach Child Development Center, Myrtle Beach Primary School, and Myrtle Beach Elementary School.
Ownership History
Date
Name
Owned For
Owner Type
Purchase Details
Closed on
Sep 25, 2024
Sold by
Lynch Mark Steven
Bought by
Lynch Mark Steven and Lynch Debra Gray
Current Estimated Value
Purchase Details
Closed on
Apr 16, 2021
Sold by
Williams Charles Steven
Bought by
Lynch Mark Steven
Purchase Details
Closed on
Jun 6, 2017
Sold by
Cowling Patricia L
Bought by
Williams Charles Steven
Purchase Details
Closed on
Dec 15, 2006
Sold by
Gavern Louis P and Gavern Donna L
Bought by
Cowling Patricia L
Home Financials for this Owner
Home Financials are based on the most recent Mortgage that was taken out on this home.
Original Mortgage
$79,200
Interest Rate
6.19%
Mortgage Type
Purchase Money Mortgage
Purchase Details
Closed on
Jun 4, 2002
Sold by
Mclean Dexter B and Mclean Nealie B
Bought by
Gavern Louis P and Gavern Donna L
Create a Home Valuation Report for This Property
The Home Valuation Report is an in-depth analysis detailing your home's value as well as a comparison with similar homes in the area
Home Values in the Area
Average Home Value in this Area
Purchase History
| Date | Buyer | Sale Price | Title Company |
|---|---|---|---|
| Lynch Mark Steven | -- | -- | |
| Lynch Mark Steven | $70,000 | -- | |
| Williams Charles Steven | $64,000 | -- | |
| Cowling Patricia L | $120,000 | None Available | |
| Gavern Louis P | $50,000 | -- |
Source: Public Records
Mortgage History
| Date | Status | Borrower | Loan Amount |
|---|---|---|---|
| Previous Owner | Cowling Patricia L | $79,200 |
Source: Public Records
Tax History Compared to Growth
Tax History
| Year | Tax Paid | Tax Assessment Tax Assessment Total Assessment is a certain percentage of the fair market value that is determined by local assessors to be the total taxable value of land and additions on the property. | Land | Improvement |
|---|---|---|---|---|
| 2024 | $2,108 | $11,280 | $0 | $11,280 |
| 2023 | $2,108 | $8,715 | $0 | $8,715 |
| 2021 | $1,945 | $8,715 | $0 | $8,715 |
| 2020 | $60 | $8,715 | $0 | $8,715 |
| 2019 | $1,067 | $8,715 | $0 | $8,715 |
| 2018 | $0 | $6,300 | $0 | $6,300 |
| 2017 | $947 | $6,300 | $0 | $6,300 |
| 2016 | -- | $3,600 | $0 | $3,600 |
| 2015 | $936 | $6,300 | $0 | $6,300 |
| 2014 | $910 | $3,600 | $0 | $3,600 |
Source: Public Records
Map
Nearby Homes
- 7500 N Ocean Blvd Unit 6082
- 7500 N Ocean Blvd Unit 6010 Ocean Dunes To
- 7500 N Ocean Blvd Unit 6061
- 7500 N Ocean Blvd Unit 6105
- 7500 N Ocean Blvd Unit 6145
- 210 75th Ave N Unit 4035
- 210 75th Ave N Unit 4053
- 210 75th Ave N Unit 4033
- 210 75th Ave N Unit 4032
- 210 75th Ave N Unit 4030
- 210 75th Ave N Unit 4011
- 213 76th Ave N Unit s A - B - C
- 7509 N Ocean Blvd Unit 502
- 7509 N Ocean Blvd Unit 902 Ocean Villas
- 7509 N Ocean Blvd Unit 104
- 7509 N Ocean Blvd Unit 101
- 211 76th Ave N Unit A-3
- 208 74th Ave N Unit 2-417
- 208 74th Ave N Unit 2517
- 208 74th Ave N Unit 2319
- 7509 N Ocean Blvd Unit 704 Ocean Villas
- 7509 N Ocean Blvd Unit OCEAN VILLAS UNIT 10
- 7509 N Ocean Blvd Unit 804 OCEAN VILLAS
- 7509 N Ocean Blvd Unit 503 Ocean Villas
- 7509 N Ocean Blvd Unit 903 OCEAN VILLAS
- 7509 N Ocean Blvd Unit 805 Ocean Villa
- 7509 N Ocean Blvd Unit 404 Ocean Villas
- 7509 N Ocean Blvd Unit 1104 OCEAN VILLAS
- 7509 N Ocean Blvd Unit 805 OCEAN VILLAS
- 7509 N Ocean Blvd Unit 604 Ocean Vil
- 7509 N Ocean Blvd Unit 404
- 7509 N Ocean Blvd
- 7509 N Ocean Blvd Unit Ocean Villas 902
- 7509 N Ocean Blvd Unit Ocean Villas
- 7509 N Ocean Blvd Unit Ocean Villas 102
- 7509 N Ocean Blvd Unit 904 Ocean Villas
- 7509 N Ocean Blvd Unit 1204
- 7509 N Ocean Blvd Unit 1204
- 7509 N Ocean Blvd Unit 1004
- 7509N N Ocean Blvd Unit 1003