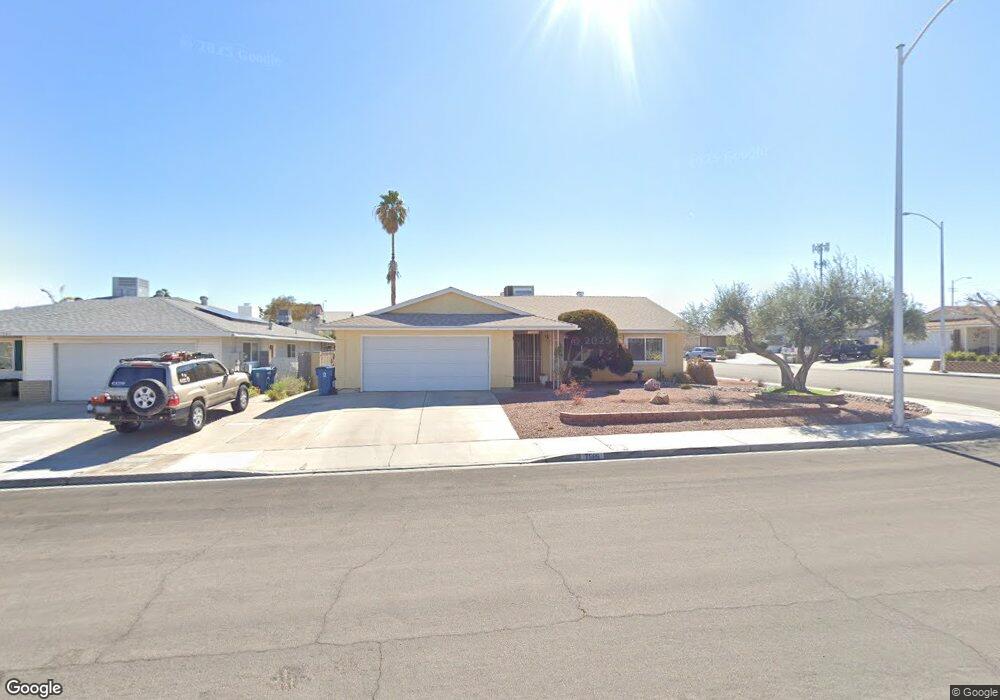
7509 Pinedale Ave Las Vegas, NV 89145
Charleston Preservation NeighborhoodEstimated Value: $253,000 - $415,000
3
Beds
2
Baths
1,620
Sq Ft
$223/Sq Ft
Est. Value
About This Home
This home is located at 7509 Pinedale Ave, Las Vegas, NV 89145 and is currently estimated at $361,507, approximately $223 per square foot. 7509 Pinedale Ave is a home located in Clark County with nearby schools including Helen M Smith Elementary School, Walter Johnson Junior High School Academy of International Studies, and Bonanza High School.
Ownership History
Date
Name
Owned For
Owner Type
Purchase Details
Closed on
Sep 15, 2020
Sold by
Thompson Maggy Andrew
Bought by
Thompson Maggy and The Maggy Thompson Living Trus
Current Estimated Value
Home Financials for this Owner
Home Financials are based on the most recent Mortgage that was taken out on this home.
Original Mortgage
$135,000
Interest Rate
2.8%
Mortgage Type
New Conventional
Purchase Details
Closed on
May 9, 2016
Sold by
Thompson Maggy
Bought by
Thompson Maggy and Maggy Thompson Living Trust
Purchase Details
Closed on
Sep 20, 2012
Sold by
Thompson Maggy
Bought by
Thompson Maggy
Purchase Details
Closed on
Oct 9, 2007
Sold by
Thompson Maggy
Bought by
Maggy Thompson Living Trust
Create a Home Valuation Report for This Property
The Home Valuation Report is an in-depth analysis detailing your home's value as well as a comparison with similar homes in the area
Home Values in the Area
Average Home Value in this Area
Purchase History
| Date | Buyer | Sale Price | Title Company |
|---|---|---|---|
| Thompson Maggy | -- | Stewart Title Company Fo | |
| Thompson Maggy Andrew | -- | Stewart Title Company Fo | |
| Thompson Maggy | -- | None Available | |
| Thompson Maggy | -- | None Available | |
| Maggy Thompson Living Trust | -- | None Available |
Source: Public Records
Mortgage History
| Date | Status | Borrower | Loan Amount |
|---|---|---|---|
| Closed | Thompson Maggy Andrew | $135,000 |
Source: Public Records
Tax History Compared to Growth
Tax History
| Year | Tax Paid | Tax Assessment Tax Assessment Total Assessment is a certain percentage of the fair market value that is determined by local assessors to be the total taxable value of land and additions on the property. | Land | Improvement |
|---|---|---|---|---|
| 2025 | $1,231 | $58,540 | $35,350 | $23,190 |
| 2024 | $1,195 | $58,540 | $35,350 | $23,190 |
| 2023 | $975 | $56,844 | $34,650 | $22,194 |
| 2022 | $975 | $49,996 | $29,050 | $20,946 |
| 2021 | $1,127 | $46,796 | $26,250 | $20,546 |
| 2020 | $1,091 | $45,813 | $24,850 | $20,963 |
| 2019 | $1,059 | $42,558 | $21,350 | $21,208 |
| 2018 | $1,029 | $39,719 | $18,900 | $20,819 |
| 2017 | $1,268 | $38,691 | $17,150 | $21,541 |
| 2016 | $975 | $35,891 | $13,300 | $22,591 |
| 2015 | $972 | $33,270 | $10,500 | $22,770 |
| 2014 | $944 | $28,286 | $6,300 | $21,986 |
Source: Public Records
Map
Nearby Homes
- 7601 Ducharme Ave Unit 201
- 304 S Buffalo Dr Unit 201
- 328 S Buffalo Dr Unit 101
- 338 Jett St Unit 101
- 332 Huntly Rd Unit 13C
- 212 Bradshaw Way
- 7716 Ducharme Ave
- 7220 Stormson Dr
- 7121 Hurricane Way
- 7200 Alta Dr
- 7212 Raincloud Dr
- 425 Cherry Meadows Ct
- 101 Luna Way Unit 145
- 101 Luna Way Unit 253
- 7700 Tomich Ave
- 7021 Stormson Dr
- 7213 Lakeland Ct
- 120 Firestone Dr
- 7012 Pinedale Ave
- 317 Coconut Grove Ct Unit 3
- 7512 Barkentine St
- 7508 Barkentine St
- 7501 Pinedale Ave
- 312 Huntly Rd
- 308 Huntly Rd
- 7508 Pinedale Ave
- 316 Huntly Rd
- 7504 Barkentine St
- 7504 Pinedale Ave
- 304 Huntly Rd
- 7413 Pinedale Ave
- 320 Huntly Rd Unit 13C
- 7500 Pinedale Ave
- 7500 Barkentine St
- 300 Huntly Rd
- 325 Huntly Rd
- 7412 Pinedale Ave
- 7509 Wandercloud Ln
- 7409 Pinedale Ave