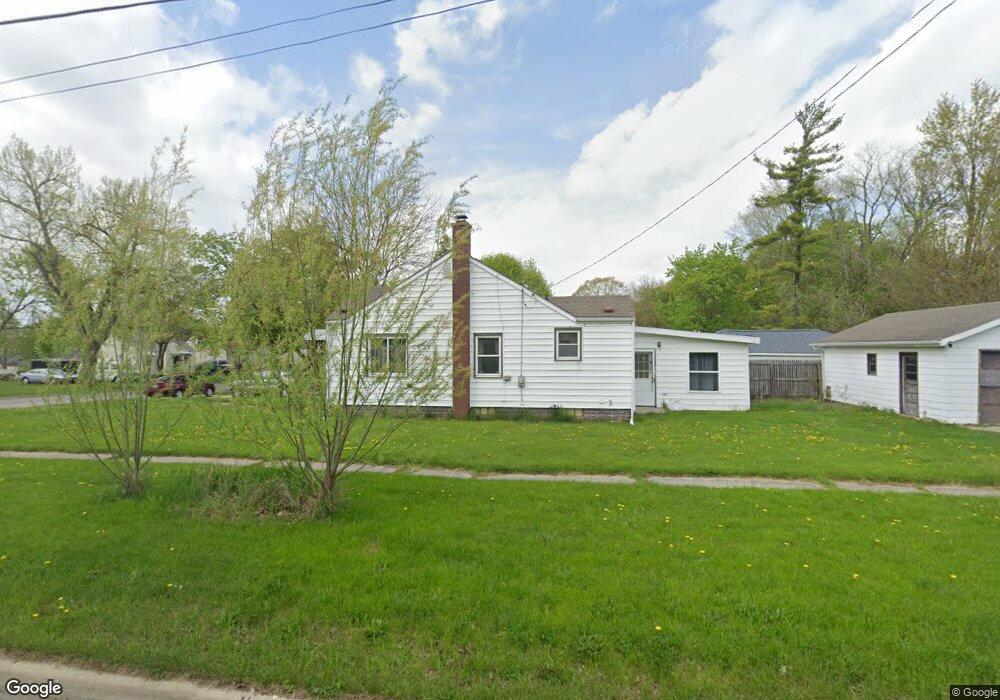
751 Dennis St Unit DENNIS Adrian, MI 49221
Estimated Value: $129,147 - $156,000
3
Beds
1
Bath
1,093
Sq Ft
$127/Sq Ft
Est. Value
About This Home
This home is located at 751 Dennis St Unit DENNIS, Adrian, MI 49221 and is currently estimated at $138,716, approximately $126 per square foot. 751 Dennis St Unit DENNIS is a home located in Lenawee County with nearby schools including Adrian High School, Berean Baptist Academy, and St. Stephen Lutheran School.
Ownership History
Date
Name
Owned For
Owner Type
Purchase Details
Closed on
Jun 26, 2013
Sold by
Goedert Mark H and Goedert Rebeca M
Bought by
Lampley Corey
Current Estimated Value
Home Financials for this Owner
Home Financials are based on the most recent Mortgage that was taken out on this home.
Original Mortgage
$33,781
Outstanding Balance
$7,721
Interest Rate
3.3%
Mortgage Type
FHA
Estimated Equity
$130,995
Purchase Details
Closed on
Oct 27, 2011
Sold by
Lampley Corey
Bought by
Goedert Mark H and Goedert Rebeca
Purchase Details
Closed on
Oct 25, 2011
Sold by
Fannie Mae
Bought by
Lampley Corey
Purchase Details
Closed on
Jun 20, 2011
Sold by
The Huntington National Bank
Bought by
Fannie Mae
Purchase Details
Closed on
Mar 10, 2011
Sold by
Gilbert April L
Bought by
The Huntington National Bank
Create a Home Valuation Report for This Property
The Home Valuation Report is an in-depth analysis detailing your home's value as well as a comparison with similar homes in the area
Home Values in the Area
Average Home Value in this Area
Purchase History
| Date | Buyer | Sale Price | Title Company |
|---|---|---|---|
| Lampley Corey | $34,000 | None Available | |
| Goedert Mark H | -- | None Available | |
| Lampley Corey | $18,000 | None Available | |
| Fannie Mae | -- | None Available | |
| The Huntington National Bank | $76,009 | None Available |
Source: Public Records
Mortgage History
| Date | Status | Borrower | Loan Amount |
|---|---|---|---|
| Open | Lampley Corey | $33,781 |
Source: Public Records
Tax History Compared to Growth
Tax History
| Year | Tax Paid | Tax Assessment Tax Assessment Total Assessment is a certain percentage of the fair market value that is determined by local assessors to be the total taxable value of land and additions on the property. | Land | Improvement |
|---|---|---|---|---|
| 2025 | $2,040 | $43,500 | $0 | $0 |
| 2024 | $1,355 | $38,900 | $0 | $0 |
| 2023 | $1,527 | $36,300 | $0 | $0 |
| 2022 | $1,336 | $34,500 | $0 | $0 |
| 2021 | $1,346 | $32,400 | $0 | $0 |
| 2020 | $1,342 | $32,600 | $0 | $0 |
| 2019 | $78,034 | $27,700 | $0 | $0 |
| 2018 | $1,606 | $32,808 | $0 | $0 |
| 2017 | $1,585 | $27,395 | $0 | $0 |
| 2016 | $1,593 | $27,913 | $0 | $0 |
| 2014 | -- | $26,500 | $0 | $0 |
Source: Public Records
Map
Nearby Homes