Estimated Value: $143,000 - $185,583
Studio
2
Baths
2,100
Sq Ft
$78/Sq Ft
Est. Value
About This Home
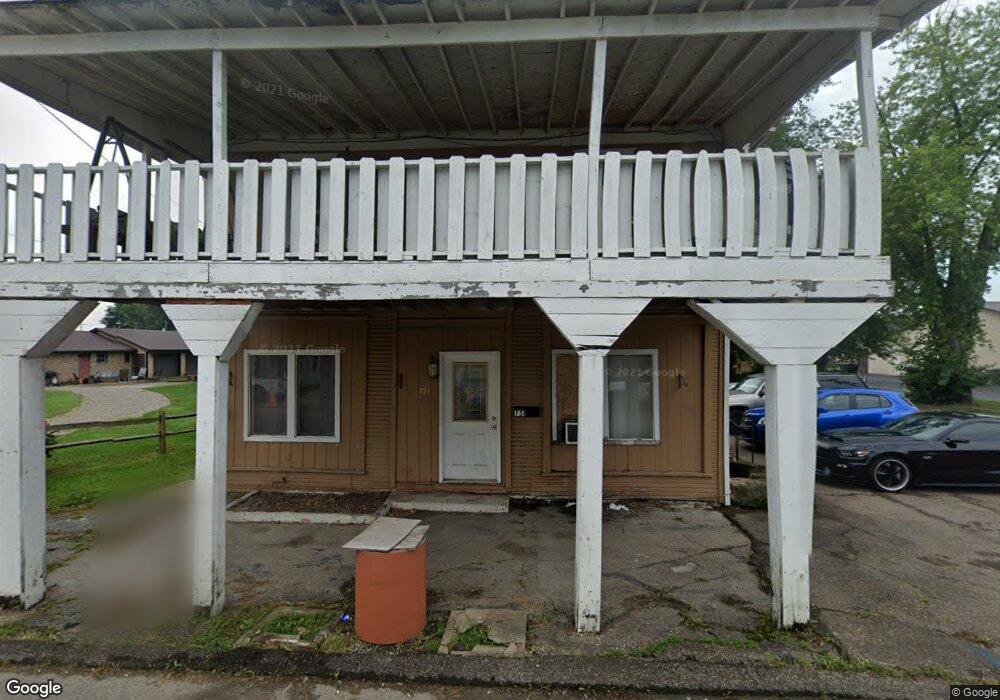
This home is located at 751 E Front St, Logan, OH 43138 and is currently estimated at $164,646, approximately $78 per square foot. 751 E Front St is a home located in Hocking County with nearby schools including Central Elementary School, St. John the Evangelist School, and Logan Christian School.
Ownership History
Date
Name
Owned For
Owner Type
Purchase Details
Closed on
Feb 4, 2022
Sold by
Skaggs Anthony
Bought by
Moder Holly Renee and Moder Brendan J
Current Estimated Value
Home Financials for this Owner
Home Financials are based on the most recent Mortgage that was taken out on this home.
Original Mortgage
$103,098
Interest Rate
6.27%
Mortgage Type
FHA
Purchase Details
Closed on
Jun 2, 2020
Sold by
Reynolds Carol
Bought by
Skaggs Anthony
Purchase Details
Closed on
Nov 18, 2017
Sold by
Reynolds Carol J
Bought by
Skaggs Anthony
Home Financials for this Owner
Home Financials are based on the most recent Mortgage that was taken out on this home.
Original Mortgage
$23,000
Interest Rate
1.27%
Mortgage Type
Land Contract Argmt. Of Sale
Purchase Details
Closed on
Sep 15, 2009
Sold by
Reynolds Gary S
Bought by
Reynolds Carol J
Create a Home Valuation Report for This Property
The Home Valuation Report is an in-depth analysis detailing your home's value as well as a comparison with similar homes in the area
Home Values in the Area
Average Home Value in this Area
Purchase History
| Date | Buyer | Sale Price | Title Company |
|---|---|---|---|
| Moder Holly Renee | $105,000 | None Listed On Document | |
| Skaggs Anthony | $65,000 | None Available | |
| Skaggs Anthony | $43,000 | None Available | |
| Reynolds Carol J | -- | None Available |
Source: Public Records
Mortgage History
| Date | Status | Borrower | Loan Amount |
|---|---|---|---|
| Previous Owner | Moder Holly Renee | $103,098 | |
| Previous Owner | Skaggs Anthony | $23,000 |
Source: Public Records
Tax History
| Year | Tax Paid | Tax Assessment Tax Assessment Total Assessment is a certain percentage of the fair market value that is determined by local assessors to be the total taxable value of land and additions on the property. | Land | Improvement |
|---|---|---|---|---|
| 2024 | $2,299 | $48,010 | $14,250 | $33,760 |
| 2023 | $1,938 | $48,010 | $14,250 | $33,760 |
| 2022 | $1,941 | $48,010 | $14,250 | $33,760 |
| 2021 | $1,421 | $32,580 | $11,240 | $21,340 |
| 2020 | $1,422 | $32,580 | $11,240 | $21,340 |
| 2019 | $1,422 | $32,580 | $11,240 | $21,340 |
| 2018 | $1,333 | $31,070 | $9,730 | $21,340 |
| 2017 | $1,257 | $31,070 | $9,730 | $21,340 |
| 2016 | $1,249 | $31,070 | $9,730 | $21,340 |
| 2015 | $1,112 | $23,890 | $8,990 | $14,900 |
| 2014 | $1,112 | $23,890 | $8,990 | $14,900 |
| 2013 | $1,118 | $23,890 | $8,990 | $14,900 |
Source: Public Records
Map
Nearby Homes
- 775 E Front St
- 750 E Front St
- 795 E Front St
- 748 E Front St
- 738 E Front St
- 772 E Front St
- 726 E Front St
- 799 E Front St
- 714 E Front St
- 794 E Front St
- 702 E Front St
- 251 Arlington Ave
- 819 E Front St
- 261 Arlington Ave
- 152 Arlington Ave
- 755 E 2nd St
- 725 E 2nd St
- 696 E Front St
- 705 E 2nd St
- 252 Arlington Ave
Your Personal Tour Guide
Ask me questions while you tour the home.