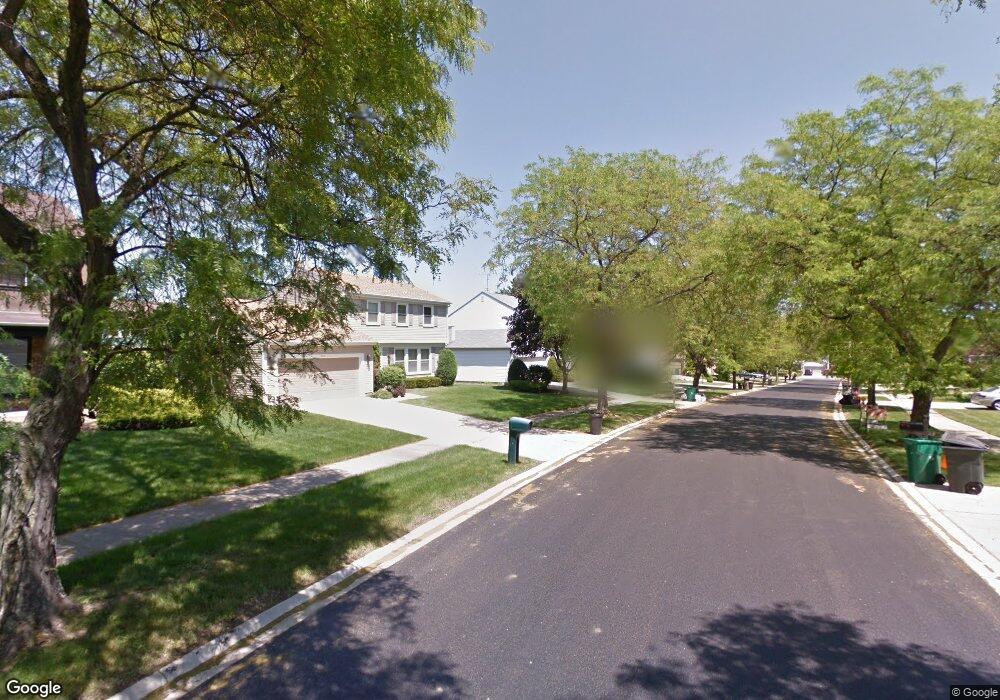
751 Heatherdown Way Buffalo Grove, IL 60089
Prairie Park-Lake County NeighborhoodEstimated Value: $517,003 - $586,000
Studio
3
Baths
2,080
Sq Ft
$273/Sq Ft
Est. Value
About This Home
This home is located at 751 Heatherdown Way, Buffalo Grove, IL 60089 and is currently estimated at $567,001, approximately $272 per square foot. 751 Heatherdown Way is a home located in Lake County with nearby schools including Prairie Elementary School, Twin Groves Middle School, and Adlai E Stevenson High School.
Ownership History
Date
Name
Owned For
Owner Type
Purchase Details
Closed on
Jul 29, 1999
Sold by
Becker Elliott F
Bought by
Burke Shaun L
Current Estimated Value
Home Financials for this Owner
Home Financials are based on the most recent Mortgage that was taken out on this home.
Original Mortgage
$204,000
Outstanding Balance
$57,936
Interest Rate
7.5%
Estimated Equity
$509,065
Purchase Details
Closed on
Oct 26, 1998
Sold by
Martin Becker Sharon J
Bought by
Becker Elliott F
Purchase Details
Closed on
Jan 23, 1996
Sold by
Martin Becker Sharon J
Bought by
Becker Elliott F
Home Financials for this Owner
Home Financials are based on the most recent Mortgage that was taken out on this home.
Original Mortgage
$172,500
Interest Rate
7.24%
Create a Home Valuation Report for This Property
The Home Valuation Report is an in-depth analysis detailing your home's value as well as a comparison with similar homes in the area
Home Values in the Area
Average Home Value in this Area
Purchase History
| Date | Buyer | Sale Price | Title Company |
|---|---|---|---|
| Burke Shaun L | $255,000 | -- | |
| Becker Elliott F | -- | -- | |
| Becker Elliott F | -- | -- |
Source: Public Records
Mortgage History
| Date | Status | Borrower | Loan Amount |
|---|---|---|---|
| Open | Burke Shaun L | $204,000 | |
| Previous Owner | Becker Elliott F | $172,500 |
Source: Public Records
Tax History
| Year | Tax Paid | Tax Assessment Tax Assessment Total Assessment is a certain percentage of the fair market value that is determined by local assessors to be the total taxable value of land and additions on the property. | Land | Improvement |
|---|---|---|---|---|
| 2024 | $12,962 | $149,516 | $39,489 | $110,027 |
| 2023 | $12,962 | $134,362 | $35,487 | $98,875 |
| 2022 | $11,947 | $120,577 | $31,846 | $88,731 |
| 2021 | $11,494 | $119,277 | $31,503 | $87,774 |
| 2020 | $11,223 | $119,683 | $31,610 | $88,073 |
| 2019 | $11,069 | $119,241 | $31,493 | $87,748 |
| 2018 | $11,225 | $124,511 | $31,123 | $93,388 |
| 2017 | $11,095 | $121,605 | $30,397 | $91,208 |
| 2016 | $10,724 | $116,447 | $29,108 | $87,339 |
| 2015 | $10,438 | $108,901 | $27,222 | $81,679 |
| 2014 | $9,124 | $94,648 | $29,235 | $65,413 |
| 2012 | $8,842 | $94,838 | $29,294 | $65,544 |
Source: Public Records
Map
Nearby Homes
- 327 Lasalle Ln
- 5176 Aptakisic Rd
- 1318 Gail Dr Unit 4
- 1265 Devonshire Rd
- 962 Thompson Blvd
- 1234 Devonshire Rd
- 1328 Larchmont Dr
- 1152 Courtland Dr Unit 406
- 1135 Thompson Blvd
- 5152 Bridlewood Ln
- 5135 Bridlewood Ct
- 1120 Courtland Dr
- 5107 N Arlington Heights Rd
- 1161 Parker Ln
- 810 Silver Rock Ln
- 1217 Franklin Ln Unit G5
- 5251 Hilltop Rd
- 938 Hidden Lake Dr
- 927 Hidden Lake Dr
- 711 Woodhollow Ln
- 741 Heatherdown Way
- 761 Heatherdown Way
- 750 Kingsbridge Way
- 740 Kingsbridge Way
- 760 Kingsbridge Way
- 731 Heatherdown Way
- 771 Heatherdown Way
- 750 Heatherdown Way
- 730 Kingsbridge Way
- 770 Kingsbridge Way
- 740 Heatherdown Way
- 760 Heatherdown Way
- 721 Heatherdown Way
- 781 Heatherdown Way
- 730 Heatherdown Way
- 720 Kingsbridge Way
- 770 Heatherdown Way
- 780 Kingsbridge Way Unit 2
- 720 Heatherdown Way
- 761 Thompson Blvd
Your Personal Tour Guide
Ask me questions while you tour the home.