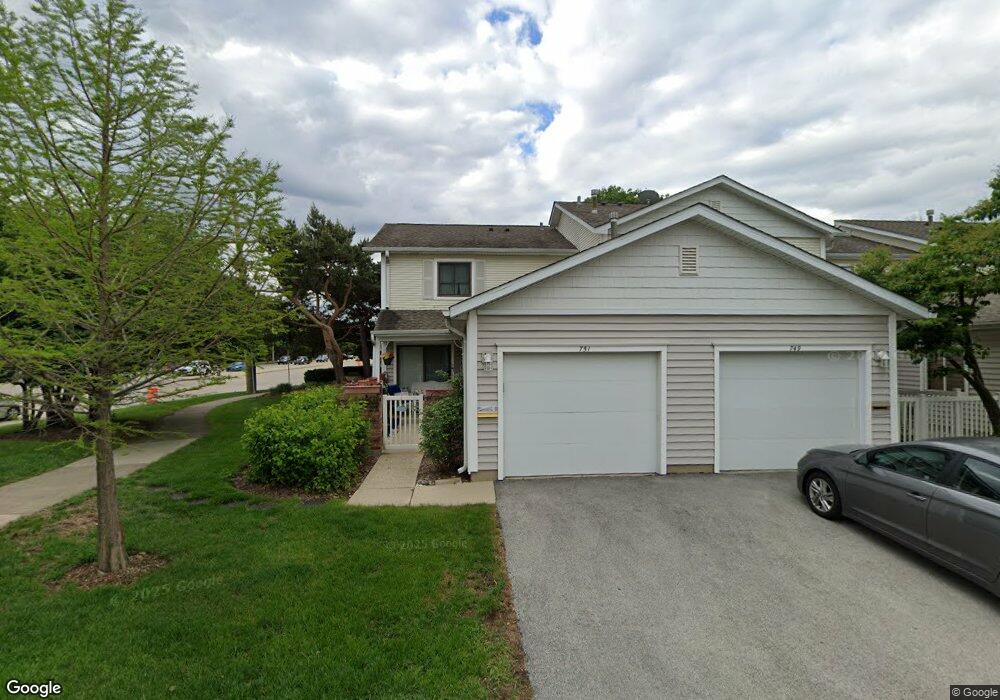
751 Lakeview Point Unit 100B Schaumburg, IL 60194
East Schaumburg NeighborhoodEstimated Value: $278,000 - $313,000
2
Beds
--
Bath
1,250
Sq Ft
$236/Sq Ft
Est. Value
About This Home
This home is located at 751 Lakeview Point Unit 100B, Schaumburg, IL 60194 and is currently estimated at $295,165, approximately $236 per square foot. 751 Lakeview Point Unit 100B is a home located in Cook County with nearby schools including Everett Dirksen Elementary School, Robert Frost Junior High School, and J B Conant High School.
Ownership History
Date
Name
Owned For
Owner Type
Purchase Details
Closed on
Feb 2, 2018
Sold by
Hunt Kathleen L
Bought by
Hunt Kathleen Lewis and Hunt James Lee
Current Estimated Value
Purchase Details
Closed on
Nov 30, 2001
Sold by
Crook Matthew J and Crook Stacy L
Bought by
Hunt James L and Hunt Kathleen L
Home Financials for this Owner
Home Financials are based on the most recent Mortgage that was taken out on this home.
Original Mortgage
$84,000
Interest Rate
6.52%
Purchase Details
Closed on
Apr 30, 1998
Sold by
Ratajczak Michael W and Ratajczak Mitzie
Bought by
Crook Matthew J and Crook Stacy L
Home Financials for this Owner
Home Financials are based on the most recent Mortgage that was taken out on this home.
Original Mortgage
$121,100
Interest Rate
7.2%
Purchase Details
Closed on
Sep 15, 1996
Sold by
Ratajczak Michael W
Bought by
Ratajczak Michael W and Ratajczak Mitzie
Create a Home Valuation Report for This Property
The Home Valuation Report is an in-depth analysis detailing your home's value as well as a comparison with similar homes in the area
Home Values in the Area
Average Home Value in this Area
Purchase History
| Date | Buyer | Sale Price | Title Company |
|---|---|---|---|
| Hunt Kathleen Lewis | -- | None Available | |
| Hunt James L | $145,000 | -- | |
| Crook Matthew J | $127,500 | -- | |
| Ratajczak Michael W | -- | -- |
Source: Public Records
Mortgage History
| Date | Status | Borrower | Loan Amount |
|---|---|---|---|
| Closed | Hunt James L | $84,000 | |
| Previous Owner | Crook Matthew J | $121,100 |
Source: Public Records
Tax History Compared to Growth
Tax History
| Year | Tax Paid | Tax Assessment Tax Assessment Total Assessment is a certain percentage of the fair market value that is determined by local assessors to be the total taxable value of land and additions on the property. | Land | Improvement |
|---|---|---|---|---|
| 2024 | $4,280 | $21,248 | $4,208 | $17,040 |
| 2023 | $4,099 | $21,248 | $4,208 | $17,040 |
| 2022 | $4,099 | $21,248 | $4,208 | $17,040 |
| 2021 | $3,090 | $16,191 | $5,391 | $10,800 |
| 2020 | $3,160 | $16,191 | $5,391 | $10,800 |
| 2019 | $3,170 | $17,999 | $5,391 | $12,608 |
| 2018 | $1,824 | $12,260 | $4,536 | $7,724 |
| 2017 | $1,827 | $12,260 | $4,536 | $7,724 |
| 2016 | $2,697 | $12,260 | $4,536 | $7,724 |
| 2015 | $2,520 | $11,045 | $3,945 | $7,100 |
| 2014 | $2,508 | $11,045 | $3,945 | $7,100 |
| 2013 | $2,426 | $11,045 | $3,945 | $7,100 |
Source: Public Records
Map
Nearby Homes
- 751 Edgelake Point Unit 68C
- 325 Bayview Point Unit 56B
- 601 Hanover Ct Unit Z2
- 602 Eastview Ct Unit Z1
- 600 Eastview Ct Unit X1
- 802 Stonewall Ct Unit 55
- 121 Chatsworth Cir
- 22 Ascot Cir
- 28 Ascot Cir
- 465 Apache Ln
- 15 Bar Harbour Rd Unit 4F
- 85 Marble Hill Ct Unit A1
- 223 Gareth Ln
- 350 Newgate Ct Unit 2Z
- 705 Ash Rd
- 91 Lambert Dr Unit B1
- 845 Dracut Ln
- 1257 Rosewood Ct Unit D1
- 1300 Woodside Ct Unit B1
- 151 Brookston Dr Unit A2
- 737 Lakeview Point Unit 103A
- 739 Lakeview Point Unit 103B
- 741 Lakeview Point Unit 102A
- 743 Lakeview Point Unit 102B
- 743 Lakeview Point Unit 743
- 745 Lakeview Point Unit 101F
- 747 Lakeview Point Unit 101A
- 736 Lakeview Point Unit 96B
- 740 Lakeview Point Unit 97A
- 742 Lakeview Point Unit 97F
- 748 Lakeview Point Unit 99B
- 750 Lakeview Point Unit 99A
- 746 Lakeview Point Unit 98A
- 744 Lakeview Point Unit 98B
- 738 Lakeview Point Unit 96D
- 744 Whitesail Dr Unit 170B
- 742 Whitesail Dr Unit 170C
- 740 Whitesail Dr Unit 170D
- 746 Whitesail Dr Unit 170A
- 750 Whitesail Dr Unit 171C