Estimated Value: $309,000 - $344,000
4
Beds
3
Baths
2,253
Sq Ft
$144/Sq Ft
Est. Value
About This Home
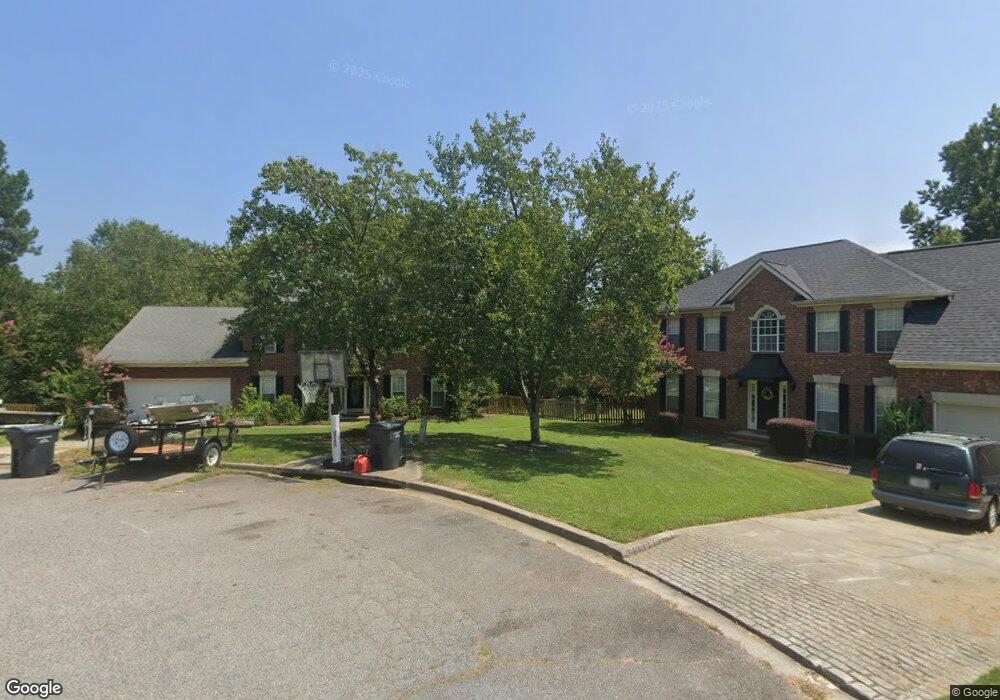
This home is located at 751 Winding Creek Ct, Evans, GA 30809 and is currently estimated at $323,384, approximately $143 per square foot. 751 Winding Creek Ct is a home located in Columbia County with nearby schools including River Ridge Elementary School, Riverside Middle School, and Greenbrier High School.
Ownership History
Date
Name
Owned For
Owner Type
Purchase Details
Closed on
Nov 6, 2017
Sold by
Kangas Timothy A
Bought by
Kangas Timothy A
Current Estimated Value
Purchase Details
Closed on
Jun 6, 2016
Sold by
Young Paul D
Bought by
Kangas Timothy A and Kangs Michelle P
Home Financials for this Owner
Home Financials are based on the most recent Mortgage that was taken out on this home.
Original Mortgage
$201,746
Interest Rate
3.61%
Mortgage Type
VA
Purchase Details
Closed on
Dec 6, 2010
Sold by
Johnson Carolyn C
Bought by
Johnson Carolyn C and Young Paul D
Home Financials for this Owner
Home Financials are based on the most recent Mortgage that was taken out on this home.
Original Mortgage
$140,000
Interest Rate
4.32%
Mortgage Type
New Conventional
Purchase Details
Closed on
Nov 20, 2001
Sold by
Johnson Robert E
Bought by
Johnson Carolyn C
Create a Home Valuation Report for This Property
The Home Valuation Report is an in-depth analysis detailing your home's value as well as a comparison with similar homes in the area
Home Values in the Area
Average Home Value in this Area
Purchase History
| Date | Buyer | Sale Price | Title Company |
|---|---|---|---|
| Kangas Timothy A | -- | -- | |
| Kangas Timothy A | $197,500 | -- | |
| Johnson Carolyn C | -- | -- | |
| Johnson Carolyn C | -- | -- |
Source: Public Records
Mortgage History
| Date | Status | Borrower | Loan Amount |
|---|---|---|---|
| Previous Owner | Kangas Timothy A | $201,746 | |
| Previous Owner | Johnson Carolyn C | $140,000 |
Source: Public Records
Tax History Compared to Growth
Tax History
| Year | Tax Paid | Tax Assessment Tax Assessment Total Assessment is a certain percentage of the fair market value that is determined by local assessors to be the total taxable value of land and additions on the property. | Land | Improvement |
|---|---|---|---|---|
| 2025 | $3,038 | $124,948 | $21,304 | $103,644 |
| 2024 | $3,135 | $123,157 | $21,304 | $101,853 |
| 2023 | $3,135 | $113,573 | $20,204 | $93,369 |
| 2022 | $2,735 | $103,027 | $18,804 | $84,223 |
| 2021 | $2,496 | $89,645 | $16,804 | $72,841 |
| 2020 | $2,319 | $81,402 | $15,304 | $66,098 |
| 2019 | $2,235 | $78,381 | $14,704 | $63,677 |
| 2018 | $2,172 | $75,858 | $13,804 | $62,054 |
| 2017 | $2,099 | $72,992 | $14,004 | $58,988 |
| 2016 | $1,913 | $68,793 | $12,680 | $56,113 |
| 2015 | $1,936 | $69,507 | $12,780 | $56,727 |
| 2014 | $1,849 | $65,456 | $12,580 | $52,876 |
Source: Public Records
Map
Nearby Homes
- 756 Winding Creek Ct
- 877 Chase Rd
- 4183 Quinn Dr
- 889 Hunting Horn Way E
- 4161 Eagle Nest Dr
- 959 Hunting Horn Way W
- 4116 Fox Brush Dr
- 876 Willow Lake
- 905 Nerium Trail
- 4196 Aerie Cir
- 905 River Bound Ct
- 207 Oleander Trail
- 846 Willow Lake
- 1027 Sluice Gate Dr
- 210 Oleander Trail
- 1015 Sluice Gate Dr
- 2003 Sumter Landing Cir
- 1103 Sumter Landing Cir
- 1088 Conn Dr
- 1085 Conn Dr
- 753 Winding Creek Ct
- 4169 Quinn Ct
- 4160 Bridlewood Trail
- 750 Winding Creek Ct
- 4165 Quinn Dr
- 4171 Quinn Ct
- 4158 Bridlewood Trail
- 4167 Quinn Dr
- 755 Winding Creek Ct
- 752 Winding Creek Ct
- 4163 Quinn Dr
- 4162 Bridlewood Trail
- 754 Winding Creek Ct
- 757 Winding Creek Ct
- 4173 Quinn Ct
- 758 Winding Creek Ct
- 885 Chase Rd
- 4161 Quinn Dr
- 883 Chase Rd
- 4175 Quinn Ct