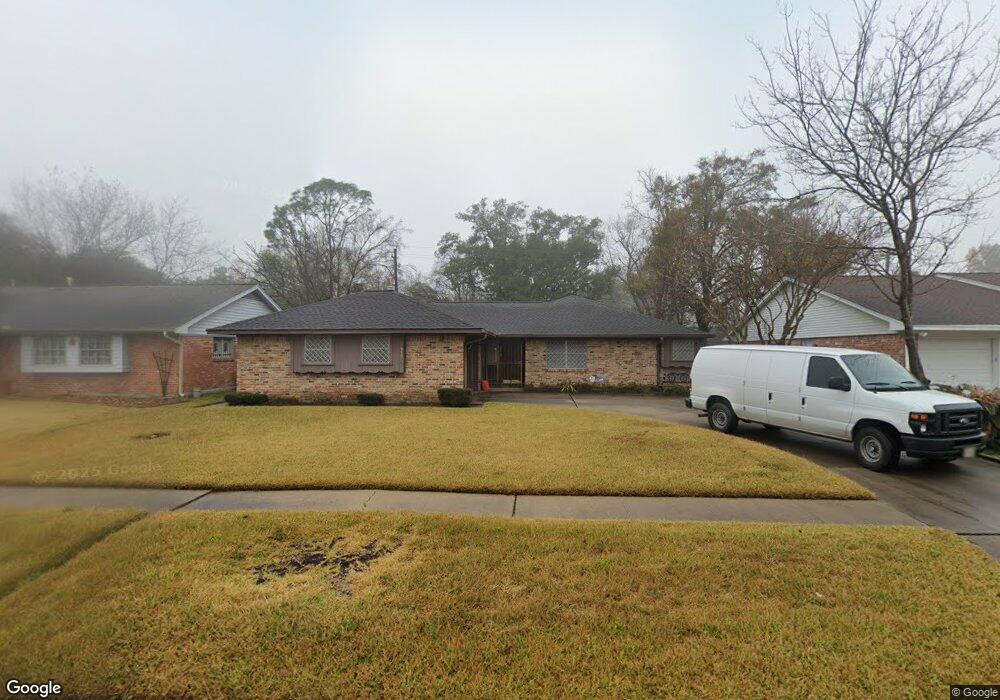
7510 Barberton Dr Houston, TX 77036
Sharpstown NeighborhoodEstimated Value: $256,000 - $280,000
3
Beds
2
Baths
1,498
Sq Ft
$177/Sq Ft
Est. Value
About This Home
This home is located at 7510 Barberton Dr, Houston, TX 77036 and is currently estimated at $264,567, approximately $176 per square foot. 7510 Barberton Dr is a home located in Harris County with nearby schools including Neff Elementary School, Sugar Grove Academy, and Sharpstown High School.
Ownership History
Date
Name
Owned For
Owner Type
Purchase Details
Closed on
Dec 31, 2013
Sold by
Covington Catherine L
Bought by
Pokorny Hal Joseph
Current Estimated Value
Purchase Details
Closed on
Jan 16, 2013
Sold by
Covington Catherine L Living Tr and Moore Margaret M
Bought by
Equity Tr Company and Schmitt Robert Ira
Purchase Details
Closed on
Mar 2, 2004
Sold by
Covington Mildred M
Bought by
Surviving James and Surviving Mildred
Purchase Details
Closed on
Apr 4, 2001
Sold by
Brown Vanessa L
Bought by
Covington Mildred M
Home Financials for this Owner
Home Financials are based on the most recent Mortgage that was taken out on this home.
Original Mortgage
$75,344
Interest Rate
6.95%
Purchase Details
Closed on
Mar 23, 2001
Sold by
Montgomery Esther Holcomb
Bought by
Brown Vanessa L
Home Financials for this Owner
Home Financials are based on the most recent Mortgage that was taken out on this home.
Original Mortgage
$75,344
Interest Rate
6.95%
Create a Home Valuation Report for This Property
The Home Valuation Report is an in-depth analysis detailing your home's value as well as a comparison with similar homes in the area
Home Values in the Area
Average Home Value in this Area
Purchase History
| Date | Buyer | Sale Price | Title Company |
|---|---|---|---|
| Pokorny Hal Joseph | -- | None Available | |
| Equity Tr Company | -- | -- | |
| Equity Tr Company | -- | -- | |
| Surviving James | -- | -- | |
| Covington Mildred M | -- | -- | |
| Brown Vanessa L | -- | -- |
Source: Public Records
Mortgage History
| Date | Status | Borrower | Loan Amount |
|---|---|---|---|
| Previous Owner | Brown Vanessa L | $75,344 |
Source: Public Records
Tax History Compared to Growth
Tax History
| Year | Tax Paid | Tax Assessment Tax Assessment Total Assessment is a certain percentage of the fair market value that is determined by local assessors to be the total taxable value of land and additions on the property. | Land | Improvement |
|---|---|---|---|---|
| 2025 | $197 | $262,971 | $135,000 | $127,971 |
| 2024 | $197 | $245,355 | $97,500 | $147,855 |
| 2023 | $197 | $248,501 | $97,500 | $151,001 |
| 2022 | $4,531 | $217,168 | $60,000 | $157,168 |
| 2021 | $4,207 | $180,516 | $60,000 | $120,516 |
| 2020 | $4,605 | $184,091 | $60,000 | $124,091 |
| 2019 | $4,730 | $181,205 | $45,000 | $136,205 |
| 2018 | $1,192 | $176,449 | $45,000 | $131,449 |
| 2017 | $4,419 | $169,874 | $45,000 | $124,874 |
| 2016 | $4,060 | $165,628 | $45,000 | $120,628 |
| 2015 | $2,479 | $146,863 | $45,000 | $101,863 |
| 2014 | $2,479 | $128,617 | $45,000 | $83,617 |
Source: Public Records
Map
Nearby Homes
- 7419 Barberton Dr
- 8019 Sharpview Dr
- 7819 Bellaire Blvd
- 7622 Troulon Dr
- 8119 Concho St
- 7210 Leader St
- 8218 Hazen St
- 7131 Mobud Dr
- 8314 Edgemoor Dr
- 7839 Fondren Rd
- 7213 Beechnut St Unit D
- 7205 Beechnut St Unit A
- 7043 Carvel Ln
- 6403 Fondren Rd Unit D25
- 7031 Triola Ln
- 6602 Harbor Town Dr Unit 1207
- 6602 Harbor Town Dr Unit 1202
- 7022 Triola Ln
- 6500 Harbor Town Dr Unit 3208
- 6500 Harbor Town Dr Unit 2808
- 7514 Barberton Dr
- 7506 Barberton Dr
- 7511 Romney Rd
- 7515 Romney Rd
- 7518 Barberton Dr
- 7507 Romney Rd
- 7502 Barberton Dr
- 7519 Romney Rd
- 7511 Barberton Dr
- 7503 Romney Rd
- 7515 Barberton Dr
- 7507 Barberton Dr
- 7522 Barberton Dr
- 7519 Barberton Dr
- 7503 Barberton Dr
- 7523 Romney Rd
- 7523 Barberton Dr
- 7526 Barberton Dr
- 7331 Galleon Dr
- 7510 Romney Rd