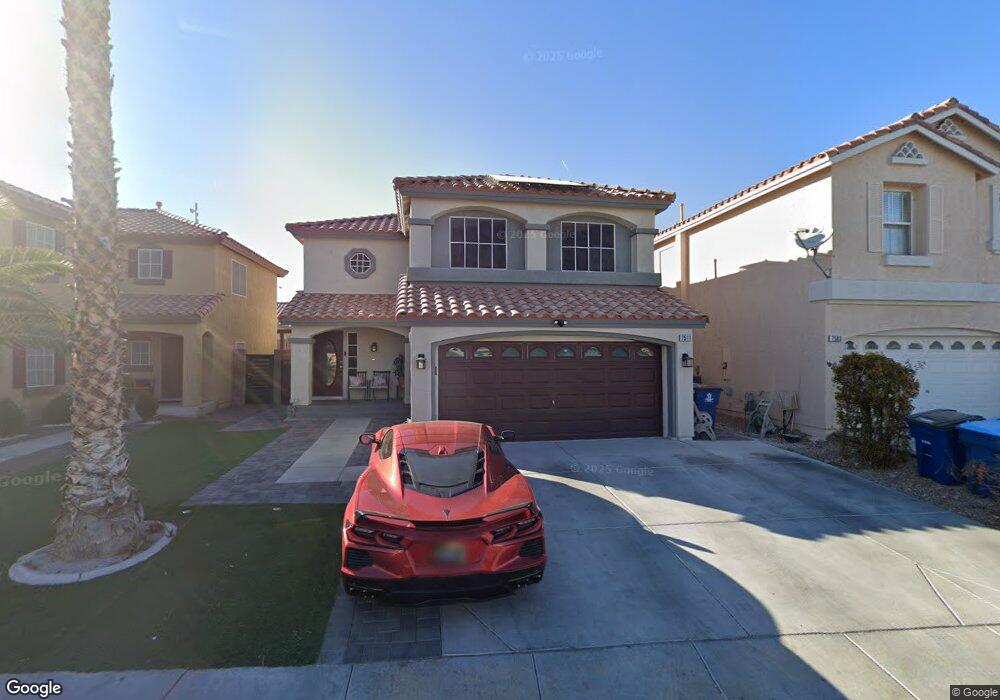
7511 Aurora Glow St Las Vegas, NV 89139
Coronado Ranch NeighborhoodEstimated Value: $470,524 - $498,000
4
Beds
3
Baths
2,001
Sq Ft
$242/Sq Ft
Est. Value
About This Home
This home is located at 7511 Aurora Glow St, Las Vegas, NV 89139 and is currently estimated at $483,631, approximately $241 per square foot. 7511 Aurora Glow St is a home located in Clark County with nearby schools including Dr. Beverly S. Mathis Elementary School, Lawrence & Heidi Canarelli Middle School, and Desert Oasis High School.
Ownership History
Date
Name
Owned For
Owner Type
Purchase Details
Closed on
Mar 26, 2022
Sold by
Ann Luu Pauline and Ann Gia Long
Bought by
Difilippo Fabian D
Current Estimated Value
Home Financials for this Owner
Home Financials are based on the most recent Mortgage that was taken out on this home.
Original Mortgage
$423,000
Outstanding Balance
$394,911
Interest Rate
3.69%
Mortgage Type
New Conventional
Estimated Equity
$88,720
Purchase Details
Closed on
Aug 20, 2012
Sold by
Christensen Darron and Christensen Lea
Bought by
Luu Pauline Ann and Luu Long Gia
Purchase Details
Closed on
Oct 9, 2002
Sold by
American West Homes Inc
Bought by
Christensen Darron and Christensen Lea
Home Financials for this Owner
Home Financials are based on the most recent Mortgage that was taken out on this home.
Original Mortgage
$179,700
Interest Rate
6.09%
Create a Home Valuation Report for This Property
The Home Valuation Report is an in-depth analysis detailing your home's value as well as a comparison with similar homes in the area
Home Values in the Area
Average Home Value in this Area
Purchase History
| Date | Buyer | Sale Price | Title Company |
|---|---|---|---|
| Difilippo Fabian D | $478,000 | Lawyers Title | |
| Luu Pauline Ann | $155,000 | First American Title Paseo | |
| Christensen Darron | $173,925 | First American Title Co |
Source: Public Records
Mortgage History
| Date | Status | Borrower | Loan Amount |
|---|---|---|---|
| Open | Difilippo Fabian D | $423,000 | |
| Previous Owner | Christensen Darron | $179,700 |
Source: Public Records
Tax History Compared to Growth
Tax History
| Year | Tax Paid | Tax Assessment Tax Assessment Total Assessment is a certain percentage of the fair market value that is determined by local assessors to be the total taxable value of land and additions on the property. | Land | Improvement |
|---|---|---|---|---|
| 2025 | $2,889 | $127,328 | $36,750 | $90,578 |
| 2024 | $2,676 | $127,328 | $36,750 | $90,578 |
| 2023 | $2,676 | $118,347 | $33,250 | $85,097 |
| 2022 | $2,478 | $106,729 | $28,700 | $78,029 |
| 2021 | $2,295 | $99,980 | $25,900 | $74,080 |
| 2020 | $2,128 | $96,878 | $23,450 | $73,428 |
| 2019 | $1,994 | $94,384 | $22,400 | $71,984 |
| 2018 | $1,903 | $86,279 | $17,150 | $69,129 |
| 2017 | $2,538 | $86,524 | $16,450 | $70,074 |
| 2016 | $1,782 | $82,007 | $12,250 | $69,757 |
| 2015 | $1,781 | $72,494 | $10,500 | $61,994 |
| 2014 | $1,726 | $57,087 | $6,300 | $50,787 |
Source: Public Records
Map
Nearby Homes
- 7468 Treasure Chest St
- 7478 Coastal Ledge St
- 5481 Railroad River Ave
- 7569 Garden Galley St
- 5431 Hasley Canyon Ave
- 6016 Sombria Ridge Ave
- 7724 Somerhill Point Way
- 7432 Decoro St
- 7766 Pacific Dunes St
- 7418 Granada Willows St
- 6111 Walker Valley Ct
- 7463 Grizzly Giant St
- 7451 Grizzly Giant St
- 5390 Montauck Ave
- 7813 Westwind Rd
- 7445 Innovation Peak Ct
- 7819 Harp Tree St
- 7658 Sandhaven St
- 7688 Sandhaven St
- 7665 Sandhaven St
- 7519 Aurora Glow St
- 7503 Aurora Glow St
- 7527 Aurora Glow St
- 7512 Mission Palm St
- 7504 Mission Palm St
- 7520 Mission Palm St Unit 2
- 7535 Aurora Glow St
- 7528 Mission Palm St
- 7528 Mission Palm St Unit n/a
- 7510 Aurora Glow St
- 7518 Aurora Glow St
- 7543 Aurora Glow St
- 7502 Aurora Glow St
- 7536 Mission Palm St
- 7489 Aurora Glow St
- 7526 Aurora Glow St
- 7490 Mission Palm St
- 7534 Aurora Glow St
- 7544 Mission Palm St
- 7551 Aurora Glow St