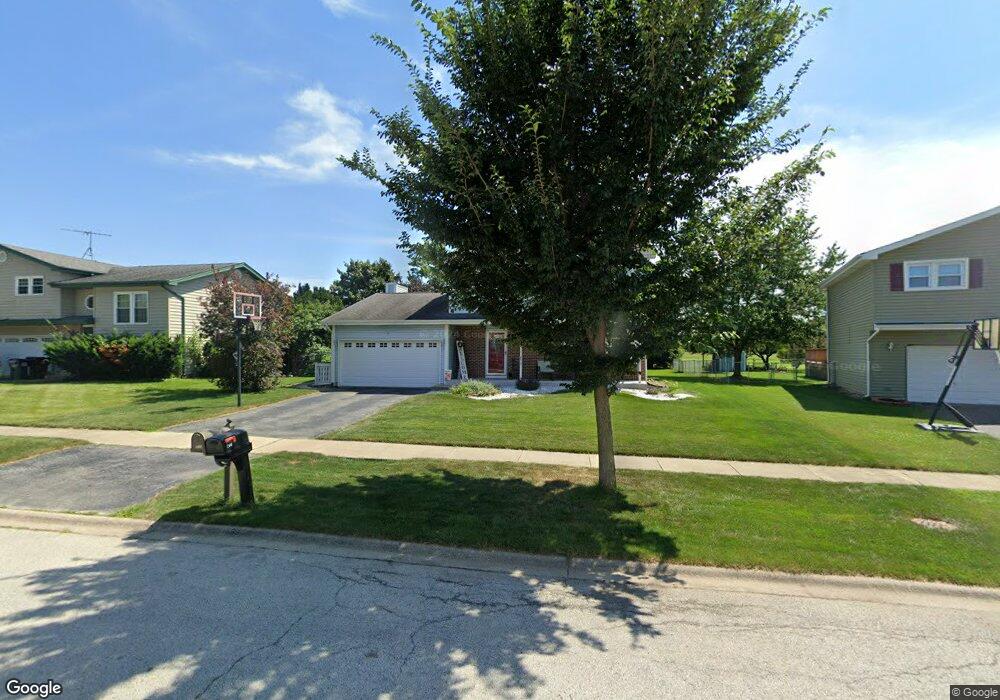
7513 W Inverness Ln Frankfort, IL 60423
Frankfort Square NeighborhoodEstimated Value: $362,000 - $399,000
3
Beds
3
Baths
1,572
Sq Ft
$241/Sq Ft
Est. Value
About This Home
This home is located at 7513 W Inverness Ln, Frankfort, IL 60423 and is currently estimated at $378,090, approximately $240 per square foot. 7513 W Inverness Ln is a home located in Will County with nearby schools including Frankfort Square Elementary School, Summit Hill Junior High School, and Lincoln-Way East High School.
Ownership History
Date
Name
Owned For
Owner Type
Purchase Details
Closed on
Nov 30, 2019
Sold by
Martino Steve L and Martino Linda M
Bought by
Martino Steve L and Martino Linda M
Current Estimated Value
Home Financials for this Owner
Home Financials are based on the most recent Mortgage that was taken out on this home.
Original Mortgage
$185,000
Outstanding Balance
$163,168
Interest Rate
3.62%
Mortgage Type
New Conventional
Estimated Equity
$214,922
Purchase Details
Closed on
Feb 28, 2002
Sold by
Donaghue Joel and Donaghue Gerylann
Bought by
Martino Steven L and Karahalios Linda M
Home Financials for this Owner
Home Financials are based on the most recent Mortgage that was taken out on this home.
Original Mortgage
$172,800
Interest Rate
7.03%
Purchase Details
Closed on
Feb 16, 1998
Sold by
Donaghue Joel B and Donaghue Gerylann
Bought by
Donaghue Joel B
Home Financials for this Owner
Home Financials are based on the most recent Mortgage that was taken out on this home.
Original Mortgage
$80,000
Interest Rate
7.23%
Create a Home Valuation Report for This Property
The Home Valuation Report is an in-depth analysis detailing your home's value as well as a comparison with similar homes in the area
Home Values in the Area
Average Home Value in this Area
Purchase History
| Date | Buyer | Sale Price | Title Company |
|---|---|---|---|
| Martino Steve L | -- | Ravenswood Title Company Llc | |
| Martino Steven L | $192,000 | Greater Illinois Title Compa | |
| Donaghue Joel B | -- | -- |
Source: Public Records
Mortgage History
| Date | Status | Borrower | Loan Amount |
|---|---|---|---|
| Open | Martino Steve L | $185,000 | |
| Closed | Martino Steven L | $172,800 | |
| Previous Owner | Donaghue Joel B | $80,000 |
Source: Public Records
Tax History Compared to Growth
Tax History
| Year | Tax Paid | Tax Assessment Tax Assessment Total Assessment is a certain percentage of the fair market value that is determined by local assessors to be the total taxable value of land and additions on the property. | Land | Improvement |
|---|---|---|---|---|
| 2024 | $8,535 | $109,194 | $19,862 | $89,332 |
| 2023 | $8,535 | $97,521 | $17,739 | $79,782 |
| 2022 | $7,562 | $88,825 | $16,157 | $72,668 |
| 2021 | $7,083 | $83,100 | $15,116 | $67,984 |
| 2020 | $6,970 | $80,758 | $14,690 | $66,068 |
| 2019 | $6,735 | $78,597 | $14,297 | $64,300 |
| 2018 | $6,485 | $76,337 | $13,886 | $62,451 |
| 2017 | $6,345 | $74,555 | $13,562 | $60,993 |
| 2016 | $6,145 | $71,999 | $13,097 | $58,902 |
| 2015 | $6,175 | $74,154 | $12,636 | $61,518 |
| 2014 | $6,175 | $73,638 | $12,548 | $61,090 |
| 2013 | $6,175 | $74,593 | $12,711 | $61,882 |
Source: Public Records
Map
Nearby Homes
- 19708 S Skye Dr
- 7758 W Kingston Dr
- 19642 S Edinburgh Ln
- 20130 S Frankfort Square Rd
- 20137 S Hampton Ct Unit A
- 7800 W Kingston Dr
- 20206 S Frankfort Square Rd Unit A
- 7752 W Almond Ct Unit 135
- 19558 S Harlem Ave
- 20027 S Jessica Ln
- 20349 S Green Meadow Ln
- 20347 S Grand Prairie Ln
- 7407 Ridgefield Ln
- 7639 W Juniper Ct
- 20513 S Acorn Ridge Dr
- 8025 Stonegate Dr
- 8131 W Evergreen Dr
- 7959 Brookside Glen Dr Unit VI
- 20552 S Frankfort Square Rd
- 7905 Richardson Ln
- 7505 W Inverness Ln
- 7519 W Inverness Ln
- 7501 W Inverness Ln
- 7525 W Inverness Ln
- 7459 W Inverness Ln
- 7529 W Inverness Ln
- 7508 W Inverness Ln Unit 2
- 7500 W Inverness Ln
- 7516 W Inverness Ln
- 7451 W Inverness Ln
- 7458 W Inverness Ln
- 7531 W Inverness Ln
- 7452 W Inverness Ln
- 7445 W Inverness Ln
- 7542 W Inverness Ln
- 7537 W Inverness Ln
- 7442 W Inverness Ln
- 7439 W Inverness Ln
- 7505 W Tartan Rd
- 19855 S Farmington Ln