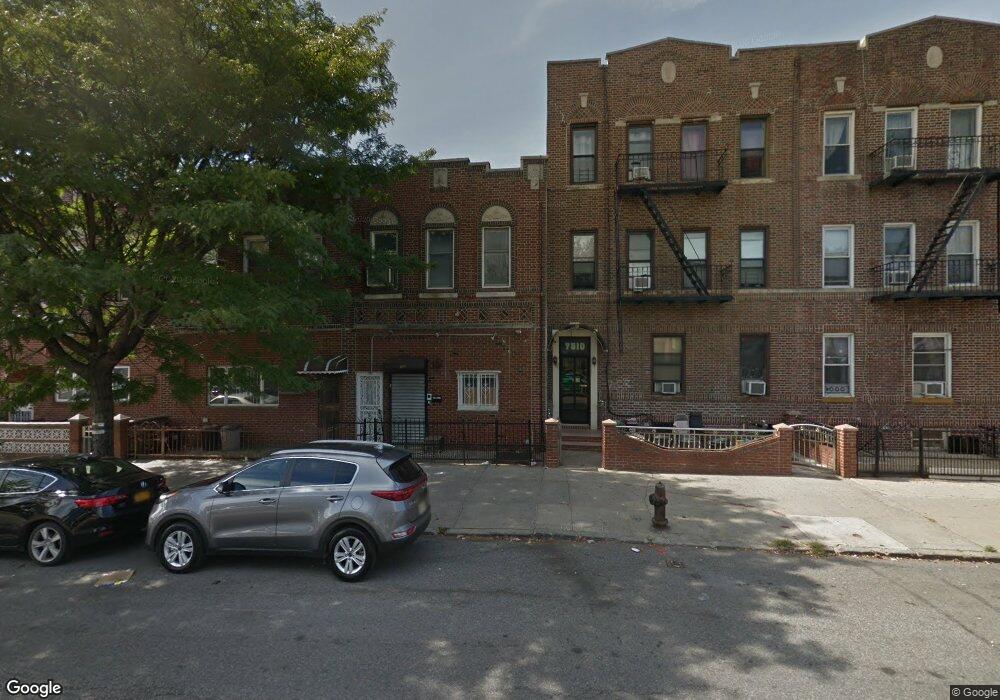
7514 20 Ave Brooklyn, NY 11214
Bensonhurst NeighborhoodEstimated Value: $1,339,558
Studio
--
Bath
3,200
Sq Ft
$419/Sq Ft
Est. Value
About This Home
This home is located at 7514 20 Ave, Brooklyn, NY 11214 and is currently estimated at $1,339,558, approximately $418 per square foot. 7514 20 Ave is a home located in Kings County with nearby schools including P.S. 186 Dr. Irving A. Gladstone Elementary School, Seth Low Intermediate School 96, and New Utrecht High School.
Ownership History
Date
Name
Owned For
Owner Type
Purchase Details
Closed on
Jan 14, 2022
Sold by
Tsui Shi Ming
Bought by
Tran Smart Group Llc
Current Estimated Value
Home Financials for this Owner
Home Financials are based on the most recent Mortgage that was taken out on this home.
Original Mortgage
$948,000
Outstanding Balance
$871,421
Interest Rate
3.22%
Mortgage Type
Purchase Money Mortgage
Estimated Equity
$468,137
Purchase Details
Closed on
Oct 22, 2003
Sold by
Tsui Shi Jen and Tsui Shi Wen
Bought by
Tsui Shi Ming
Purchase Details
Closed on
Oct 25, 1999
Sold by
Tsui Shi Wen
Bought by
Tsui Shi Wen and Tsui Shi Jen
Create a Home Valuation Report for This Property
The Home Valuation Report is an in-depth analysis detailing your home's value as well as a comparison with similar homes in the area
Home Values in the Area
Average Home Value in this Area
Purchase History
| Date | Buyer | Sale Price | Title Company |
|---|---|---|---|
| Tran Smart Group Llc | $1,185,000 | -- | |
| Tran Smart Group Llc | $1,185,000 | -- | |
| Tran Smart Group Llc | $1,185,000 | -- | |
| Tsui Shi Ming | $150,000 | -- | |
| Tsui Shi Ming | $150,000 | -- | |
| Tsui Shi Wen | $475,000 | -- | |
| Tsui Shi Wen | -- | -- |
Source: Public Records
Mortgage History
| Date | Status | Borrower | Loan Amount |
|---|---|---|---|
| Open | Tran Smart Group Llc | $948,000 | |
| Closed | Tran Smart Group Llc | $948,000 |
Source: Public Records
Tax History
| Year | Tax Paid | Tax Assessment Tax Assessment Total Assessment is a certain percentage of the fair market value that is determined by local assessors to be the total taxable value of land and additions on the property. | Land | Improvement |
|---|---|---|---|---|
| 2025 | $16,682 | $159,300 | $36,000 | $123,300 |
| 2024 | $16,682 | $157,500 | $36,000 | $121,500 |
| 2023 | $16,672 | $156,600 | $36,000 | $120,600 |
| 2022 | $16,116 | $149,850 | $36,000 | $113,850 |
| 2021 | $15,496 | $144,900 | $36,000 | $108,900 |
| 2020 | $9,453 | $186,300 | $36,000 | $150,300 |
| 2019 | $17,686 | $177,300 | $36,000 | $141,300 |
| 2018 | $17,080 | $175,950 | $36,000 | $139,950 |
| 2017 | $16,633 | $169,650 | $36,000 | $133,650 |
| 2016 | $16,271 | $162,000 | $36,000 | $126,000 |
| 2015 | $10,738 | $156,150 | $36,000 | $120,150 |
| 2014 | $10,738 | $148,500 | $36,000 | $112,500 |
Source: Public Records
Map
Nearby Homes
Your Personal Tour Guide
Ask me questions while you tour the home.