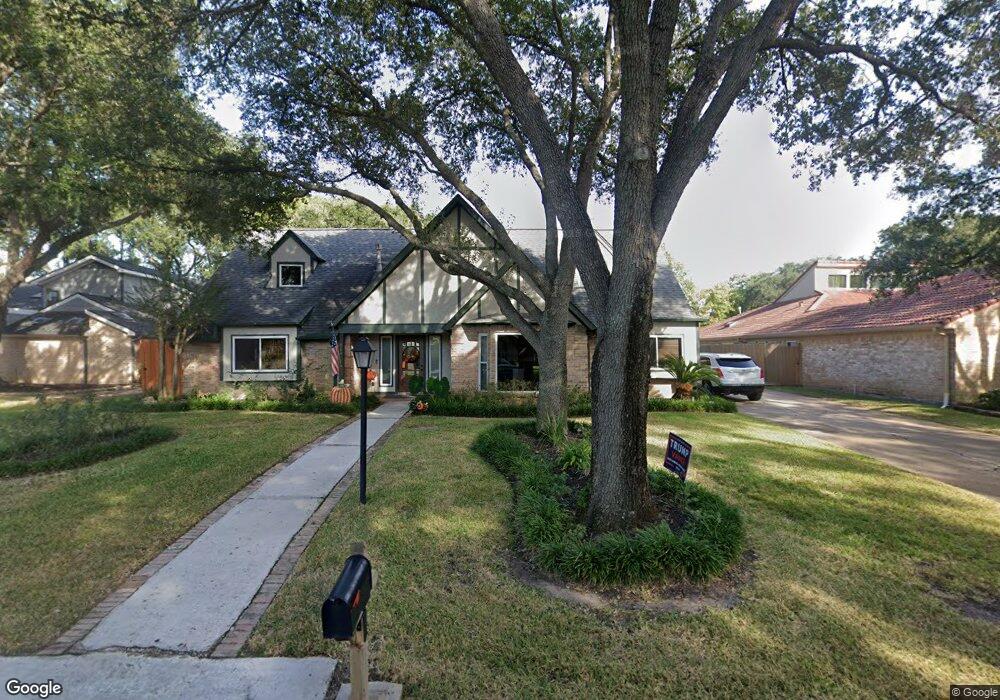
7514 Bull Creek Rd Houston, TX 77095
Hearthstone NeighborhoodEstimated Value: $402,398 - $557,000
4
Beds
4
Baths
3,152
Sq Ft
$146/Sq Ft
Est. Value
About This Home
This home is located at 7514 Bull Creek Rd, Houston, TX 77095 and is currently estimated at $459,350, approximately $145 per square foot. 7514 Bull Creek Rd is a home located in Harris County with nearby schools including Owens Elementary School, Labay Middle School, and Cypress Falls High School.
Ownership History
Date
Name
Owned For
Owner Type
Purchase Details
Closed on
Oct 27, 2015
Sold by
Hood Jimmy L and Hood June Ashworth
Bought by
Mccoya Steven D and Mccoya Lorraine K
Current Estimated Value
Home Financials for this Owner
Home Financials are based on the most recent Mortgage that was taken out on this home.
Original Mortgage
$301,500
Outstanding Balance
$237,051
Interest Rate
3.94%
Mortgage Type
New Conventional
Estimated Equity
$222,299
Purchase Details
Closed on
Aug 8, 2014
Sold by
Sehnert Sally and Lehnert Lawrence J
Bought by
Hood Jimmy L and Hood Ashworth
Home Financials for this Owner
Home Financials are based on the most recent Mortgage that was taken out on this home.
Original Mortgage
$250,125
Interest Rate
4.17%
Mortgage Type
New Conventional
Purchase Details
Closed on
Dec 26, 2013
Sold by
Burki Sajjad I and Burki Naila
Bought by
Lehnert Lawrence
Create a Home Valuation Report for This Property
The Home Valuation Report is an in-depth analysis detailing your home's value as well as a comparison with similar homes in the area
Home Values in the Area
Average Home Value in this Area
Purchase History
| Date | Buyer | Sale Price | Title Company |
|---|---|---|---|
| Mccoya Steven D | -- | First American Title | |
| Hood Jimmy L | -- | American Title Company | |
| Hood Jimmy L | -- | American Title Company | |
| Lehnert Lawrence | -- | American Title Co |
Source: Public Records
Mortgage History
| Date | Status | Borrower | Loan Amount |
|---|---|---|---|
| Open | Mccoya Steven D | $301,500 | |
| Previous Owner | Hood Jimmy L | $250,125 |
Source: Public Records
Tax History Compared to Growth
Tax History
| Year | Tax Paid | Tax Assessment Tax Assessment Total Assessment is a certain percentage of the fair market value that is determined by local assessors to be the total taxable value of land and additions on the property. | Land | Improvement |
|---|---|---|---|---|
| 2025 | $2,566 | $379,667 | $93,949 | $285,718 |
| 2024 | $2,566 | $418,665 | $93,949 | $324,716 |
| 2023 | $2,566 | $419,800 | $93,949 | $325,851 |
| 2022 | $7,688 | $345,459 | $72,047 | $273,412 |
| 2021 | $7,335 | $293,300 | $72,047 | $221,253 |
| 2020 | $7,271 | $289,200 | $60,520 | $228,680 |
| 2019 | $7,340 | $282,780 | $39,770 | $243,010 |
| 2018 | $2,818 | $275,877 | $39,770 | $236,107 |
| 2017 | $7,190 | $275,877 | $39,770 | $236,107 |
| 2016 | $7,190 | $275,877 | $39,770 | $236,107 |
| 2015 | $5,189 | $275,877 | $39,770 | $236,107 |
| 2014 | $5,189 | $195,506 | $39,770 | $155,736 |
Source: Public Records
Map
Nearby Homes
- 7407 Bull Creek Rd
- 7418 Benwich Cir
- 14823 Elmont Dr
- 7827 Alamar Dr
- 7637 Ameswood Rd
- 14911 Sandalfoot St
- 7202 Benwich Cir
- 7306 Creek Crest Dr
- 7215 Creek Crest Dr
- 7106 Halfpenny Rd
- 15110 Runbell Place
- 7111 Winding Walk Dr
- 14931 Inverrary Dr
- 7238 N Hearthstone Green Dr
- 7203 W Hearthstone Green Dr
- 7415 Broken Ridge Dr
- 7315 Muirfield Valley Dr
- 14919 Forest Trails Dr
- 7411 Pacific Ridge Ct
- 15131 New Hastings Dr
- 7510 Bull Creek Rd
- 7518 Bull Creek Rd
- 7522 Bull Creek Rd
- 15014 Elmont Dr
- 7515 Bull Creek Rd
- 7511 Bull Creek Rd
- 15006 Elmont Dr
- 7519 Bull Creek Rd
- 7507 Bull Creek Rd
- 15002 Elmont Dr
- 7523 Bull Creek Rd
- 7503 Bull Creek Rd
- 14938 Elmont Dr
- 7422 Bull Creek Rd
- 7427 Bull Creek Rd
- 14934 Elmont Dr
- 7423 Betanna Dr
- 7423 Bull Creek Rd
- 7418 Bull Creek Rd
- 14930 Elmont Dr