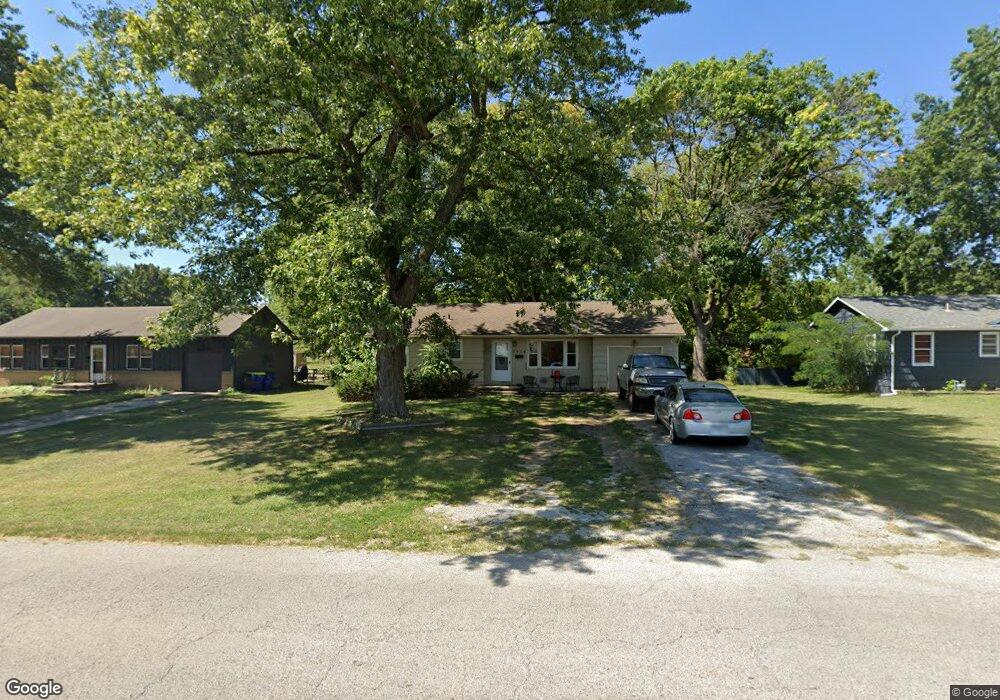
7514 Woodson Rd Raytown, MO 64138
Estimated Value: $177,000 - $199,000
3
Beds
1
Bath
876
Sq Ft
$211/Sq Ft
Est. Value
About This Home
This home is located at 7514 Woodson Rd, Raytown, MO 64138 and is currently estimated at $184,775, approximately $210 per square foot. 7514 Woodson Rd is a home located in Jackson County with nearby schools including Robinson Elementary School and Raytown Central Middle School.
Ownership History
Date
Name
Owned For
Owner Type
Purchase Details
Closed on
Jun 1, 2023
Sold by
Mj Kontractors Llc
Bought by
Richey Todd M
Current Estimated Value
Home Financials for this Owner
Home Financials are based on the most recent Mortgage that was taken out on this home.
Original Mortgage
$126,285
Outstanding Balance
$122,908
Interest Rate
6.39%
Mortgage Type
New Conventional
Estimated Equity
$61,867
Purchase Details
Closed on
Oct 7, 2004
Sold by
Kidd James R and Kidd Martha F
Bought by
Kidd Kontractors Llc
Purchase Details
Closed on
May 27, 2004
Sold by
Cordell Duane B and Cordell Leslie A
Bought by
Kidd James R and Kidd Martha F
Home Financials for this Owner
Home Financials are based on the most recent Mortgage that was taken out on this home.
Original Mortgage
$62,000
Interest Rate
5.93%
Mortgage Type
Purchase Money Mortgage
Purchase Details
Closed on
Oct 4, 2001
Sold by
Cordell D B
Bought by
Cordell Duane B and Cordell Leslie A
Create a Home Valuation Report for This Property
The Home Valuation Report is an in-depth analysis detailing your home's value as well as a comparison with similar homes in the area
Home Values in the Area
Average Home Value in this Area
Purchase History
| Date | Buyer | Sale Price | Title Company |
|---|---|---|---|
| Richey Todd M | -- | Chicago Title | |
| Kidd Kontractors Llc | -- | -- | |
| Kidd James R | -- | Security Land Title Company | |
| Cordell Duane B | -- | -- |
Source: Public Records
Mortgage History
| Date | Status | Borrower | Loan Amount |
|---|---|---|---|
| Open | Richey Todd M | $126,285 | |
| Previous Owner | Kidd James R | $62,000 |
Source: Public Records
Tax History
| Year | Tax Paid | Tax Assessment Tax Assessment Total Assessment is a certain percentage of the fair market value that is determined by local assessors to be the total taxable value of land and additions on the property. | Land | Improvement |
|---|---|---|---|---|
| 2025 | $1,726 | $18,594 | $5,533 | $13,061 |
| 2024 | $1,714 | $19,129 | $5,369 | $13,760 |
| 2023 | $1,714 | $19,129 | $3,317 | $15,812 |
| 2022 | $1,323 | $14,060 | $5,871 | $8,189 |
| 2021 | $1,327 | $14,060 | $5,871 | $8,189 |
| 2020 | $1,330 | $13,959 | $5,871 | $8,088 |
| 2019 | $1,323 | $13,959 | $5,871 | $8,088 |
| 2018 | $1,102 | $12,044 | $3,288 | $8,756 |
| 2016 | $1,069 | $11,742 | $3,327 | $8,415 |
Source: Public Records
Map
Nearby Homes
- 7606 Woodson Rd
- 7427 & 7429 Englewood Ln
- 7423 & 7425 Englewood Ln
- 11800 E 77th St
- 11605 E 78th St
- 7308 Crisp Ave
- 7520 Lewis Ave
- 7828 Westridge Rd
- 7141 Sterling Ave
- 12305 E 78th St
- 10604 E 75th St
- 7923 Harris Ave
- 8001 Westridge Rd Unit 102
- 10601 E 78th Terrace
- 7420 Hardy Ave
- 8132 Sterling Ave
- 7007 Lakeshore Dr
- 6828 Vermont Ave
- 6817 Englewood Ave
- 8008 Hardy Ave
- 7516 Woodson Rd
- 7512 Woodson Rd
- 7518 Woodson Rd
- 7510 Woodson Rd
- 7521 Englewood Ave
- 7517 Englewood Ave
- 7601 Englewood Ave
- 7513 Englewood Ave
- 7508 Woodson Rd
- 7605 Englewood Ave
- 7509 Englewood Ave
- 7601 Woodson Rd
- 7602 Woodson Rd
- 7609 Englewood Ave
- 7600 Englewood Ave
- 7516 Englewood Ave
- 7512 Englewood Ave
- 11509 E 75th St
- 7505 Englewood Ave
- 7604 Woodson Rd
Your Personal Tour Guide
Ask me questions while you tour the home.