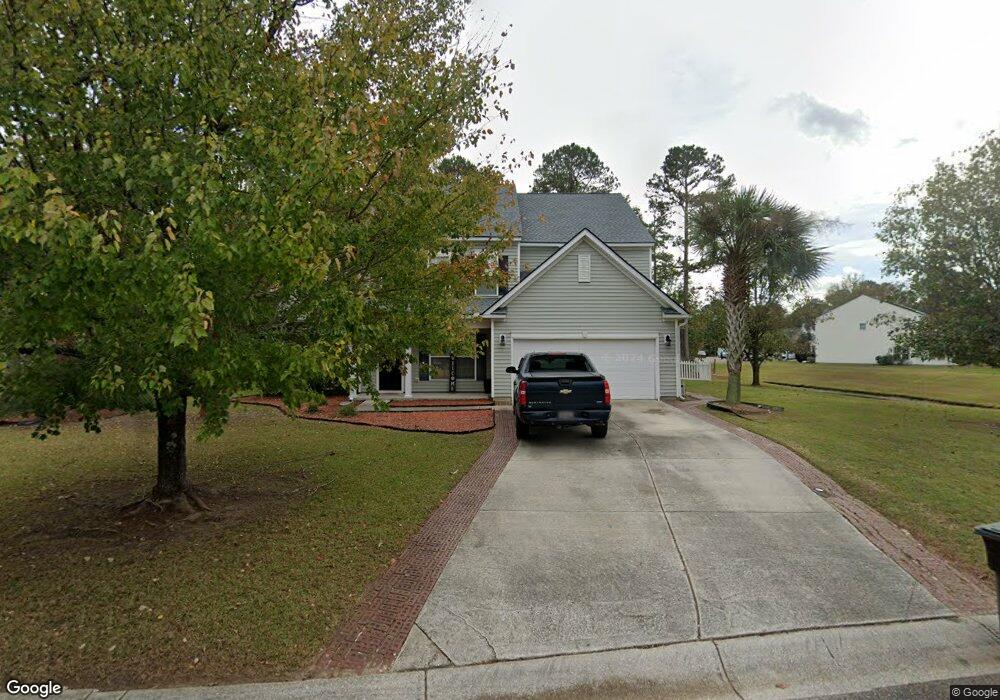
7515 Hawks Cir Hanahan, SC 29410
Estimated Value: $579,000 - $667,000
5
Beds
3
Baths
3,012
Sq Ft
$203/Sq Ft
Est. Value
About This Home
This home is located at 7515 Hawks Cir, Hanahan, SC 29410 and is currently estimated at $610,789, approximately $202 per square foot. 7515 Hawks Cir is a home located in Berkeley County with nearby schools including Bowen's Corner Elementary, Hanahan Middle School, and Hanahan High School.
Ownership History
Date
Name
Owned For
Owner Type
Purchase Details
Closed on
Dec 19, 2014
Sold by
Bailey Kristan A and Bailey Shauna J
Bought by
Teixeira Merton A and Teixeira Linda M
Current Estimated Value
Home Financials for this Owner
Home Financials are based on the most recent Mortgage that was taken out on this home.
Original Mortgage
$280,912
Outstanding Balance
$216,047
Interest Rate
4.03%
Mortgage Type
VA
Estimated Equity
$394,742
Purchase Details
Closed on
Dec 13, 2013
Sold by
Wade Susan D and Wade William S
Bought by
Bailey Kristan A and Bailey Shauna J
Purchase Details
Closed on
Jun 9, 2006
Sold by
The Ryland Group Inc
Bought by
Wade Susan D and Wade William S
Home Financials for this Owner
Home Financials are based on the most recent Mortgage that was taken out on this home.
Original Mortgage
$244,701
Interest Rate
6.49%
Mortgage Type
Future Advance Clause Open End Mortgage
Purchase Details
Closed on
Jan 4, 2006
Sold by
Foster Creek Llc
Bought by
The Ryland Group Inc
Create a Home Valuation Report for This Property
The Home Valuation Report is an in-depth analysis detailing your home's value as well as a comparison with similar homes in the area
Home Values in the Area
Average Home Value in this Area
Purchase History
| Date | Buyer | Sale Price | Title Company |
|---|---|---|---|
| Teixeira Merton A | $275,000 | -- | |
| Bailey Kristan A | $242,450 | -- | |
| Wade Susan D | $305,877 | None Available | |
| The Ryland Group Inc | $417,099 | None Available |
Source: Public Records
Mortgage History
| Date | Status | Borrower | Loan Amount |
|---|---|---|---|
| Open | Teixeira Merton A | $280,912 | |
| Previous Owner | Wade Susan D | $244,701 |
Source: Public Records
Tax History Compared to Growth
Tax History
| Year | Tax Paid | Tax Assessment Tax Assessment Total Assessment is a certain percentage of the fair market value that is determined by local assessors to be the total taxable value of land and additions on the property. | Land | Improvement |
|---|---|---|---|---|
| 2025 | $1,990 | $359,985 | $64,283 | $295,702 |
| 2024 | $1,990 | $14,399 | $2,571 | $11,828 |
| 2023 | $1,990 | $14,399 | $2,571 | $11,828 |
| 2022 | $1,939 | $12,521 | $1,881 | $10,640 |
| 2021 | $1,823 | $12,520 | $1,881 | $10,640 |
| 2020 | $1,715 | $12,521 | $1,881 | $10,640 |
| 2019 | $1,781 | $12,521 | $1,881 | $10,640 |
| 2018 | $1,637 | $10,888 | $2,000 | $8,888 |
| 2017 | $1,602 | $10,888 | $2,000 | $8,888 |
| 2016 | $1,575 | $10,890 | $2,000 | $8,890 |
| 2015 | $1,380 | $10,490 | $2,000 | $8,490 |
| 2014 | $1,311 | $10,080 | $2,000 | $8,080 |
| 2013 | -- | $10,080 | $2,000 | $8,080 |
Source: Public Records
Map
Nearby Homes
- 7532 Hawks Cir
- 1038 Old Cypress Run
- 7502 Scupper Dr
- 115 Milton Dr
- 133 Hanahan Plantation Cir
- 202 Waterwood Dr Unit 2302
- 7406 Mercedes Way
- 7402 Purser Ln
- 201 Greenmeadow Dr
- 202 Greenmeadow Dr
- 605 Waterwood Dr Unit 1505
- 607 Waterwood Dr
- 7434 Northgate Dr
- 902 Greenmeadow Dr Unit 1702
- 1005 Waterwood Dr
- 1001 Waterwood Dr Unit 1301
- 806 Greenmeadow Dr Unit 406
- 1333 Song Sparrow Way
- 103 Greencastle Dr
- 1104 Greenmeadow Dr Unit 1604
- 7513 Hawks Cir
- 1502 Saint Stephens Way
- 7520 Hawks Cir
- 1502 St Stephens Way
- 7523 Hawks Cir
- 7518 Hawks Cir
- 7524 Hawks Cir
- 7516 Hawks Cir
- 7509 Hawks Cir
- 7514 Hawks Cir
- 1501 Saint Stephens Way
- 7512 Hawks Cir
- 1501 St Stephens Way
- 7526 Hawks Cir
- 7525 Hawks Cir
- 7510 Hawks Cir
- 1504 Saint Stephens Way
- 7507 Hawks Cir
- 109 Dillard Dr
- 7528 Hawks Cir