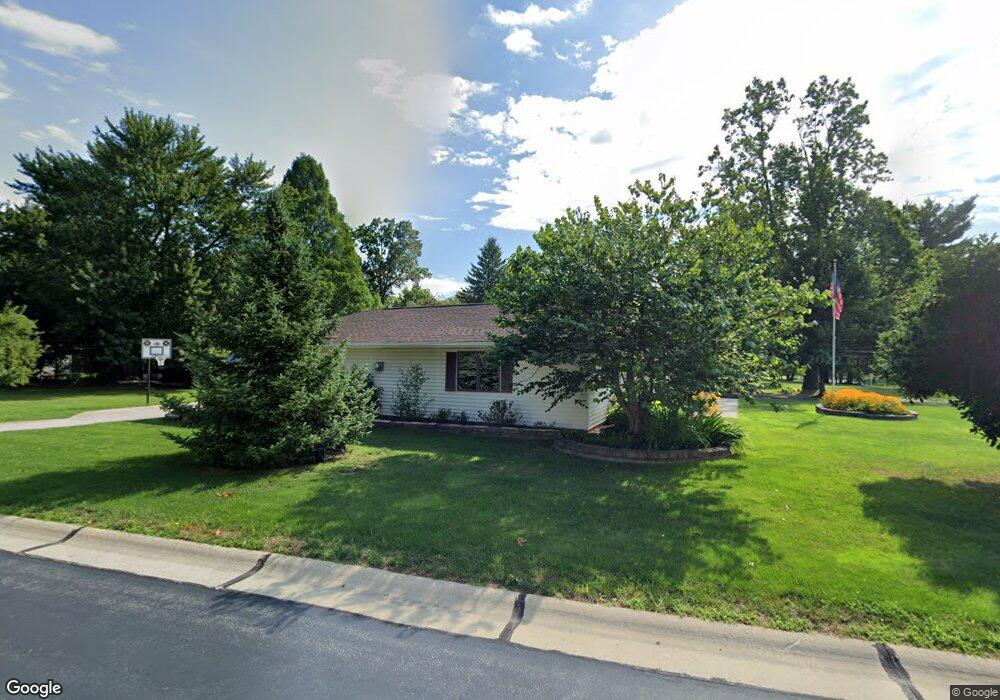
7515 Hillside Rd Independence, OH 44131
Estimated Value: $236,000 - $290,000
3
Beds
2
Baths
1,064
Sq Ft
$244/Sq Ft
Est. Value
About This Home
This home is located at 7515 Hillside Rd, Independence, OH 44131 and is currently estimated at $260,027, approximately $244 per square foot. 7515 Hillside Rd is a home located in Cuyahoga County with nearby schools including Independence Primary School, Independence Middle School, and Independence High School.
Ownership History
Date
Name
Owned For
Owner Type
Purchase Details
Closed on
Sep 6, 1996
Sold by
Streibel Ann M
Bought by
Streibel Joseph R and Streibel Marian L
Current Estimated Value
Home Financials for this Owner
Home Financials are based on the most recent Mortgage that was taken out on this home.
Original Mortgage
$60,000
Interest Rate
7.78%
Mortgage Type
New Conventional
Purchase Details
Closed on
Mar 29, 1985
Sold by
Streibel Robert J
Bought by
Streibel Robert J
Purchase Details
Closed on
Jul 23, 1979
Sold by
Wyer Douglas M and Wyer Linda K
Bought by
Streibel Robert J
Purchase Details
Closed on
Oct 29, 1975
Sold by
Okress John J and Okress Judith
Bought by
Wyer Douglas M and Wyer Linda K
Purchase Details
Closed on
Jan 1, 1975
Bought by
Okress John J and Okress Judith
Create a Home Valuation Report for This Property
The Home Valuation Report is an in-depth analysis detailing your home's value as well as a comparison with similar homes in the area
Home Values in the Area
Average Home Value in this Area
Purchase History
| Date | Buyer | Sale Price | Title Company |
|---|---|---|---|
| Streibel Joseph R | $100,000 | -- | |
| Streibel Robert J | -- | -- | |
| Streibel Robert J | $68,000 | -- | |
| Wyer Douglas M | $46,000 | -- | |
| Okress John J | -- | -- |
Source: Public Records
Mortgage History
| Date | Status | Borrower | Loan Amount |
|---|---|---|---|
| Closed | Streibel Joseph R | $60,000 |
Source: Public Records
Tax History
| Year | Tax Paid | Tax Assessment Tax Assessment Total Assessment is a certain percentage of the fair market value that is determined by local assessors to be the total taxable value of land and additions on the property. | Land | Improvement |
|---|---|---|---|---|
| 2024 | $3,849 | $80,465 | $17,605 | $62,860 |
| 2023 | $3,388 | $64,370 | $16,840 | $47,530 |
| 2022 | $3,369 | $64,370 | $16,840 | $47,530 |
| 2021 | $3,320 | $64,370 | $16,840 | $47,530 |
| 2020 | $3,246 | $59,050 | $15,440 | $43,610 |
| 2019 | $3,134 | $168,700 | $44,100 | $124,600 |
| 2018 | $3,162 | $59,050 | $15,440 | $43,610 |
| 2017 | $3,464 | $62,340 | $14,740 | $47,600 |
| 2016 | $3,429 | $62,340 | $14,740 | $47,600 |
| 2015 | $3,426 | $62,340 | $14,740 | $47,600 |
| 2014 | $3,426 | $62,340 | $14,740 | $47,600 |
Source: Public Records
Map
Nearby Homes
- 7311 Brecksville Rd
- 7003 Brecksville Rd
- 6312 E Pleasant Valley Rd
- 8420 Stone Rd
- 0 Brecksville Rd
- 6990 S Great Oaks Pkwy
- SL 23 Kingscote Park
- 9800 Gleeson Dr
- 6119 E Sprague Rd
- 7477 Ludwin Dr
- VL TBB Laura Lee Ln
- VL Laura Lee Ln
- 6626 Hawthorne Dr
- 0 Daisy Blvd
- 6752 Rivercrest Dr
- 7817 Daniel Dr
- 0 Acorn Dr Unit 5023848
- 8001 Robin Ln
- 6895 Carriage Hill Dr Unit E77
- 10635 Tanager Trail
- 7523 Hillside Rd
- 7419 Hillside Rd
- 7071 Greenwood St
- 7599 Hillside Rd
- 7415 Hillside Rd
- 7100 Greenwood St
- 7416 Hillside Rd
- 7065 Greenwood St
- 7623 Hillside Rd
- 7410 Hillside Rd
- 7411 Hillside Rd
- 7090 Greenwood St
- 7404 Hillside Rd
- 7327 Hillside Rd
- 7099 Hemoga St
- 7420 Hillside Rd
- 7330 Hillside Rd
- 7070 Greenwood St
- 7055 Greenwood St
- 7719 Hillside Rd
Your Personal Tour Guide
Ask me questions while you tour the home.