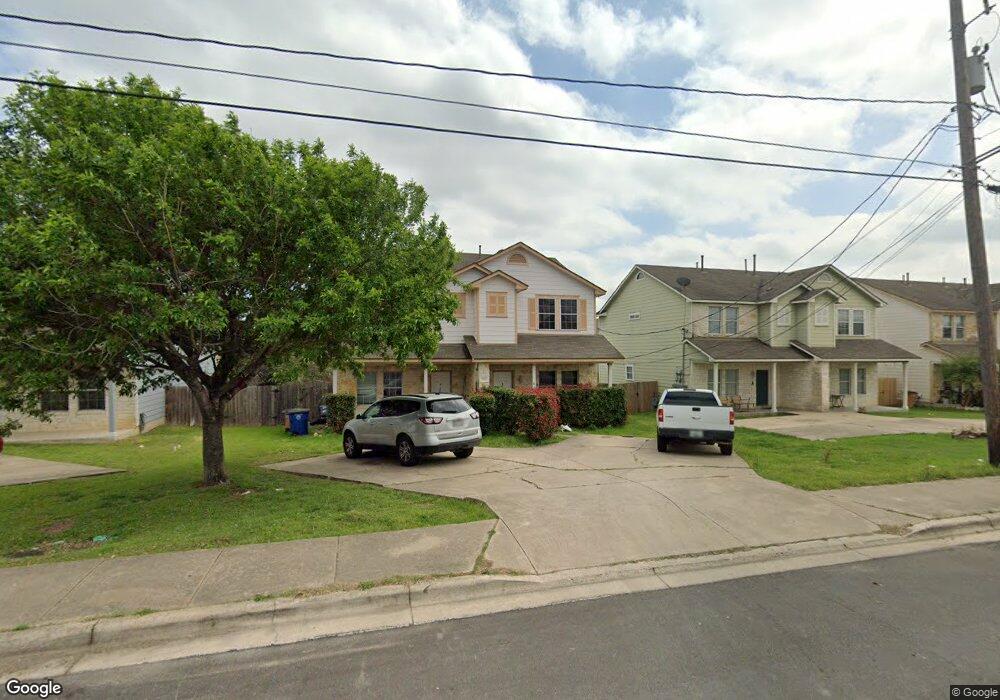
7515 Lazy Creek Dr Unit B Austin, TX 78724
LBJ NeighborhoodEstimated Value: $499,521 - $568,000
3
Beds
3
Baths
2,713
Sq Ft
$197/Sq Ft
Est. Value
About This Home
This home is located at 7515 Lazy Creek Dr Unit B, Austin, TX 78724 and is currently estimated at $535,630, approximately $197 per square foot. 7515 Lazy Creek Dr Unit B is a home located in Travis County with nearby schools including Jordan Elementary School, Dobie Middle School, and LBJ Early College High School.
Ownership History
Date
Name
Owned For
Owner Type
Purchase Details
Closed on
Oct 2, 2015
Sold by
Western States Housing Income Fund Ii
Bought by
Flores Bustamante Obed Hinojos and Flores Velazquez Fabiola
Current Estimated Value
Home Financials for this Owner
Home Financials are based on the most recent Mortgage that was taken out on this home.
Original Mortgage
$270,019
Outstanding Balance
$213,095
Interest Rate
3.97%
Mortgage Type
FHA
Estimated Equity
$322,535
Purchase Details
Closed on
Feb 11, 2013
Sold by
Janowski James M and Janowski Kim E
Bought by
Federal Home Loan Mortgage Corporation
Purchase Details
Closed on
Oct 27, 2006
Sold by
Mcdaniel Demetrius
Bought by
Opp Homes Inc
Home Financials for this Owner
Home Financials are based on the most recent Mortgage that was taken out on this home.
Original Mortgage
$213,750
Interest Rate
6.28%
Mortgage Type
Purchase Money Mortgage
Create a Home Valuation Report for This Property
The Home Valuation Report is an in-depth analysis detailing your home's value as well as a comparison with similar homes in the area
Home Values in the Area
Average Home Value in this Area
Purchase History
| Date | Buyer | Sale Price | Title Company |
|---|---|---|---|
| Flores Bustamante Obed Hinojos | -- | None Available | |
| Federal Home Loan Mortgage Corporation | $172,684 | None Available | |
| Opp Homes Inc | -- | Fidelity National Title |
Source: Public Records
Mortgage History
| Date | Status | Borrower | Loan Amount |
|---|---|---|---|
| Open | Flores Bustamante Obed Hinojos | $270,019 | |
| Previous Owner | Opp Homes Inc | $213,750 |
Source: Public Records
Tax History Compared to Growth
Tax History
| Year | Tax Paid | Tax Assessment Tax Assessment Total Assessment is a certain percentage of the fair market value that is determined by local assessors to be the total taxable value of land and additions on the property. | Land | Improvement |
|---|---|---|---|---|
| 2025 | $11,453 | $534,982 | $103,272 | $431,710 |
| 2023 | $11,579 | $639,992 | $100,000 | $539,992 |
| 2022 | $11,847 | $599,847 | $100,000 | $499,847 |
| 2021 | $9,318 | $428,073 | $50,000 | $378,073 |
| 2020 | $5,880 | $274,142 | $50,000 | $224,142 |
| 2018 | $6,127 | $276,719 | $50,000 | $226,719 |
| 2017 | $5,810 | $260,543 | $50,000 | $210,543 |
| 2016 | $6,039 | $270,777 | $15,000 | $255,777 |
| 2015 | $4,117 | $171,292 | $15,000 | $156,292 |
| 2014 | $4,117 | $172,990 | $15,000 | $157,990 |
Source: Public Records
Map
Nearby Homes
- 7517 Lazy Creek Dr
- 7514 Uray Dr
- 7611 Uray Dr
- 5507 Burgundy Dr
- 7829 Crystalbrook W
- 5200 Purple Sage Dr
- 5209 Purple Sage Dr
- 5105 Purple Sage Dr
- 7209 Gunnison Pass
- 5513 Durango Pass
- 5408 Mars Ln
- 5703 Purple Sage Dr
- 3110 Val Dr
- 6809 Ellsworth Walk
- 5305 Hallowell Ct
- 7000 Bryn Mawr Cove
- 6907 Tulane Dr
- 5704 Whitebrook Dr
- 6710 Kings Point W
- 5804 Whitebrook Dr
- 7515 Lazy Creek Dr Unit A
- 7515 Lazy Creek Dr
- 7513 Lazy Creek Dr Unit B
- 7513 Lazy Creek Dr Unit A
- 7513 Lazy Creek Dr
- 7517 Lazy Creek Dr Unit A
- 7520 Rio Pass
- 7522 Rio Pass
- 7511 Lazy Creek Dr Unit B
- 7511 Lazy Creek Dr Unit A
- 7511 Lazy Creek Dr
- 7518 Rio Pass
- 7519 Lazy Creek Dr Unit B
- 7519 Lazy Creek Dr
- 7516 Rio Pass
- 7524 Rio Pass
- 7514 Rio Pass
- 7526 Rio Pass
- 7509 Lazy Creek Dr Unit A
- 7509 Lazy Creek Dr Unit B