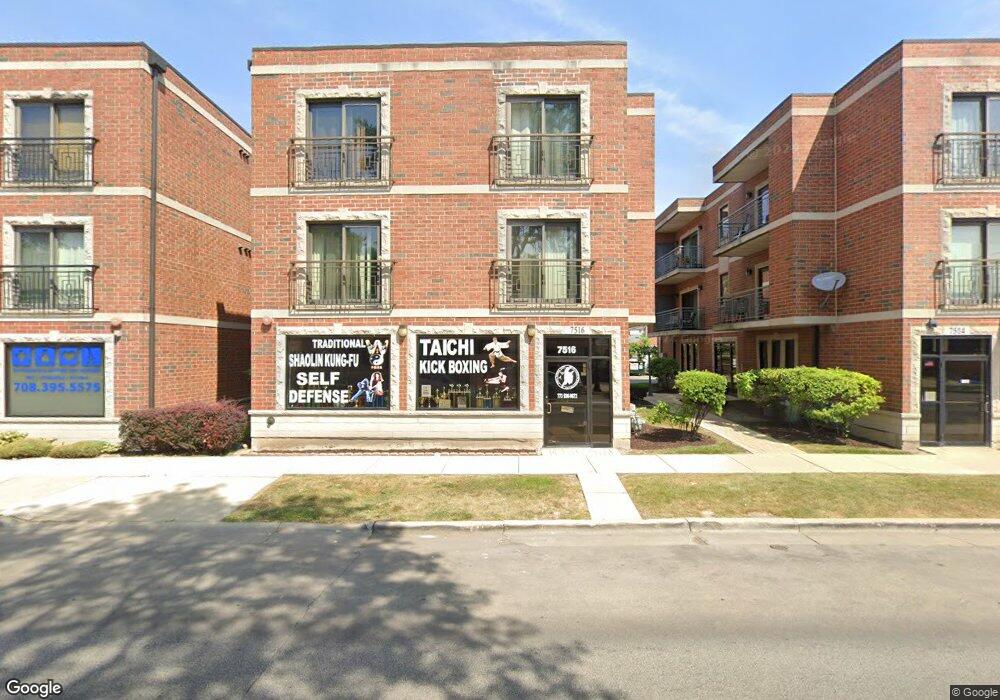
7516 W Diversey Ave Unit 3SW Elmwood Park, IL 60707
Estimated Value: $236,000 - $288,000
2
Beds
--
Bath
950
Sq Ft
$282/Sq Ft
Est. Value
About This Home
This home is located at 7516 W Diversey Ave Unit 3SW, Elmwood Park, IL 60707 and is currently estimated at $268,143, approximately $282 per square foot. 7516 W Diversey Ave Unit 3SW is a home located in Cook County with nearby schools including John Mills Elementary School, Elm Middle School, and Elmwood Park High School.
Ownership History
Date
Name
Owned For
Owner Type
Purchase Details
Closed on
Mar 28, 2024
Sold by
Stanisz Agnieszka H
Bought by
Hrebenchenko Andriy
Current Estimated Value
Home Financials for this Owner
Home Financials are based on the most recent Mortgage that was taken out on this home.
Original Mortgage
$187,500
Outstanding Balance
$176,960
Interest Rate
7%
Mortgage Type
New Conventional
Estimated Equity
$91,183
Purchase Details
Closed on
Aug 14, 2008
Sold by
La Salle Bank Na
Bought by
Stanisz Agnieszka H
Home Financials for this Owner
Home Financials are based on the most recent Mortgage that was taken out on this home.
Original Mortgage
$101,000
Interest Rate
6.52%
Mortgage Type
Purchase Money Mortgage
Purchase Details
Closed on
Feb 4, 2008
Sold by
Casarrubias
Bought by
Lasalle Bank Na and Mlmi Trust Series 2006-Mln1
Purchase Details
Closed on
May 3, 2006
Sold by
Diversified Ii Llc
Bought by
Casarrubias Juan
Home Financials for this Owner
Home Financials are based on the most recent Mortgage that was taken out on this home.
Original Mortgage
$188,000
Interest Rate
7.7%
Mortgage Type
Fannie Mae Freddie Mac
Create a Home Valuation Report for This Property
The Home Valuation Report is an in-depth analysis detailing your home's value as well as a comparison with similar homes in the area
Home Values in the Area
Average Home Value in this Area
Purchase History
| Date | Buyer | Sale Price | Title Company |
|---|---|---|---|
| Hrebenchenko Andriy | $250,000 | Saturn Title | |
| Stanisz Agnieszka H | $127,000 | Ticor | |
| Lasalle Bank Na | -- | None Available | |
| Casarrubias Juan | $235,000 | Cti |
Source: Public Records
Mortgage History
| Date | Status | Borrower | Loan Amount |
|---|---|---|---|
| Open | Hrebenchenko Andriy | $187,500 | |
| Previous Owner | Stanisz Agnieszka H | $101,000 | |
| Previous Owner | Casarrubias Juan | $188,000 |
Source: Public Records
Tax History Compared to Growth
Tax History
| Year | Tax Paid | Tax Assessment Tax Assessment Total Assessment is a certain percentage of the fair market value that is determined by local assessors to be the total taxable value of land and additions on the property. | Land | Improvement |
|---|---|---|---|---|
| 2024 | $6,016 | $23,197 | $1,129 | $22,068 |
| 2023 | $5,807 | $23,197 | $1,129 | $22,068 |
| 2022 | $5,807 | $23,197 | $1,129 | $22,068 |
| 2021 | $3,047 | $11,442 | $752 | $10,690 |
| 2020 | $3,026 | $11,442 | $752 | $10,690 |
| 2019 | $2,739 | $12,821 | $752 | $12,069 |
| 2018 | $2,596 | $11,430 | $648 | $10,782 |
| 2017 | $2,529 | $11,430 | $648 | $10,782 |
| 2016 | $2,882 | $12,676 | $648 | $12,028 |
| 2015 | $2,516 | $10,722 | $585 | $10,137 |
| 2014 | $2,468 | $10,722 | $585 | $10,137 |
| 2013 | $2,390 | $10,722 | $585 | $10,137 |
Source: Public Records
Map
Nearby Homes
- 2832 N 75th Ave
- 2908 N 75th Ct
- 2734 N 74th Ct
- 2730 N 74th Ct Unit GW
- 2719 N 74th Ct
- 2709 N 76th Ct
- 2915 N 74th Ave Unit 2
- 3009 N Oriole Ave Unit 103
- 3013 N Oriole Ave
- 2711 N 77th Ave
- 7722 W Sunset Dr
- 39 W Conti Pkwy Unit 1S
- 2724 N 73rd Ave
- 2716 N 73rd Ave
- 2922 N 77th Ct
- 2637 N 73rd Ct
- 7816 W Sunset Dr
- 2734 N 72nd Ct
- 3030 N 77th Ave
- 2521 N 76th Ave Unit 2SW
- 7516 W Diversey Ave Unit 2SW
- 7516 W Diversey Ave Unit 2NW
- 7516 W Diversey Ave Unit 3NW
- 7516 W Diversey Ave Unit 1CW
- 7516 W Diversey Ave Unit 3W
- 7516 W Diversey Ave Unit 3S
- 7516 W Diversey Ave
- 7514 W Diversey Ave Unit 3SE
- 7514 W Diversey Ave Unit 2NE
- 7514 W Diversey Ave Unit 3NE
- 7514 W Diversey Ave Unit 2SE
- 7514 W Diversey Ave Unit 3N
- 7514 W Diversey Ave Unit 3S
- 7514 W Diversey Ave Unit 1CE
- 2807 N 75th Ct Unit 2C
- 2807 N 75th Ct Unit 3C
- 7520 W Diversey Ave Unit 1A
- 2805 N 75th Ct Unit 1B
- 2805 N 75th Ct Unit 3B
- 2805 N 75th Ct Unit 2A