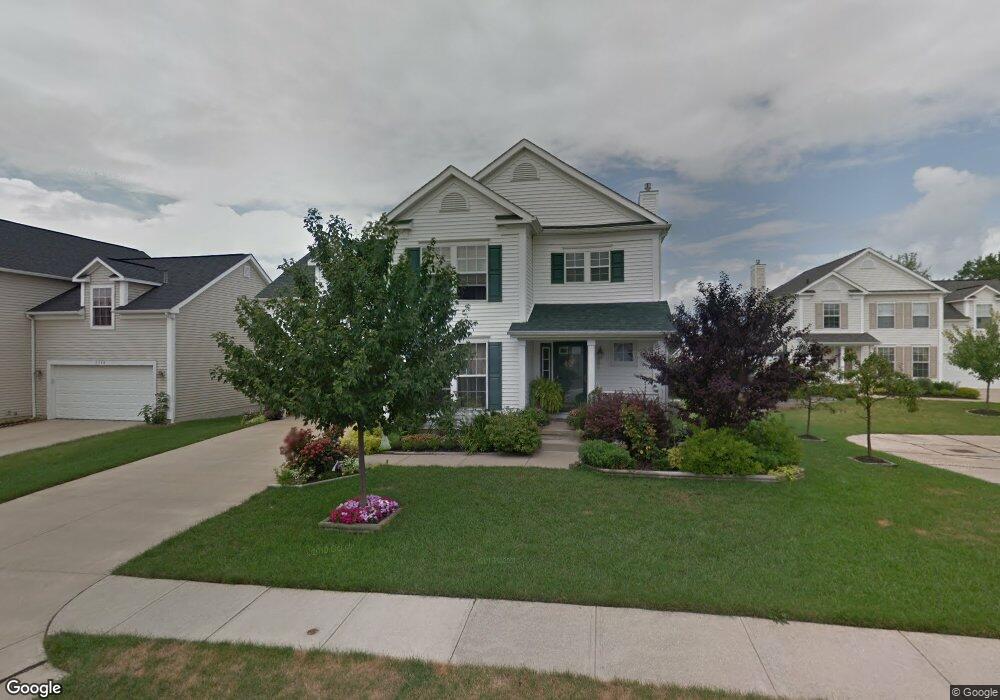
7518 W Oralee Ln Unit 21 Hudson, OH 44236
Estimated Value: $391,752 - $418,000
4
Beds
3
Baths
1,843
Sq Ft
$222/Sq Ft
Est. Value
About This Home
This home is located at 7518 W Oralee Ln Unit 21, Hudson, OH 44236 and is currently estimated at $409,688, approximately $222 per square foot. 7518 W Oralee Ln Unit 21 is a home located in Summit County with nearby schools including Lee Eaton Elementary School, Nordonia Middle School, and Nordonia High School.
Ownership History
Date
Name
Owned For
Owner Type
Purchase Details
Closed on
May 19, 2009
Sold by
Gunderson Scott E and Trites Nicole A
Bought by
Khrenov Vitaliy V and Khrenova Olga
Current Estimated Value
Home Financials for this Owner
Home Financials are based on the most recent Mortgage that was taken out on this home.
Original Mortgage
$192,600
Outstanding Balance
$122,016
Interest Rate
4.9%
Mortgage Type
Purchase Money Mortgage
Estimated Equity
$287,672
Purchase Details
Closed on
May 14, 2004
Sold by
Whitlatch & Co
Bought by
Gunderson Scott E and Trites Gunderson Nicole A
Home Financials for this Owner
Home Financials are based on the most recent Mortgage that was taken out on this home.
Original Mortgage
$170,250
Interest Rate
4.5%
Mortgage Type
Purchase Money Mortgage
Create a Home Valuation Report for This Property
The Home Valuation Report is an in-depth analysis detailing your home's value as well as a comparison with similar homes in the area
Home Values in the Area
Average Home Value in this Area
Purchase History
| Date | Buyer | Sale Price | Title Company |
|---|---|---|---|
| Khrenov Vitaliy V | $214,000 | Barristers Of Ohio | |
| Gunderson Scott E | $212,829 | General Title Agency Inc |
Source: Public Records
Mortgage History
| Date | Status | Borrower | Loan Amount |
|---|---|---|---|
| Open | Khrenov Vitaliy V | $192,600 | |
| Closed | Gunderson Scott E | $170,250 | |
| Closed | Gunderson Scott E | $31,750 |
Source: Public Records
Tax History Compared to Growth
Tax History
| Year | Tax Paid | Tax Assessment Tax Assessment Total Assessment is a certain percentage of the fair market value that is determined by local assessors to be the total taxable value of land and additions on the property. | Land | Improvement |
|---|---|---|---|---|
| 2025 | $5,635 | $99,628 | $21,613 | $78,015 |
| 2024 | $5,635 | $99,628 | $21,613 | $78,015 |
| 2023 | $5,635 | $99,628 | $21,613 | $78,015 |
| 2022 | $5,066 | $78,572 | $17,017 | $61,555 |
| 2021 | $5,095 | $78,572 | $17,017 | $61,555 |
| 2020 | $5,147 | $78,580 | $17,020 | $61,560 |
| 2019 | $5,661 | $80,630 | $16,680 | $63,950 |
| 2018 | $5,570 | $80,630 | $16,680 | $63,950 |
| 2017 | $4,437 | $80,630 | $16,680 | $63,950 |
| 2016 | $4,610 | $72,770 | $16,680 | $56,090 |
| 2015 | $4,437 | $72,770 | $16,680 | $56,090 |
| 2014 | $4,429 | $72,770 | $16,680 | $56,090 |
| 2013 | $4,339 | $71,170 | $16,680 | $54,490 |
Source: Public Records
Map
Nearby Homes
- 1366 Twinsburg Rd E
- VL Valley View Rd
- 987 Silverberry Ln
- 1593 Stonington Dr
- 1644 Stonington Dr
- 7488 Valley View Rd
- 7914 Creekside Pkwy
- 930 Chinaberry Cir S
- 1440 E Hines Hill Rd
- 7380 Walters Rd
- 1453 Prospect Rd
- 2061 Garden Ln
- 2219 Fairway Blvd Unit 4E
- 2047 Fairway Blvd Unit 22A
- 2142 Kirtland Place
- 1556 W Prospect St
- 1897 Case St
- 1927 Case St
- 2064 Case St
- 1051 Riviera Way
- 7518 W Oralee Ln
- 7510 W Oralee Ln
- 7526 W Oralee Ln
- 7526 W Oralee Ln Unit 20
- 7502 W Oralee Ln
- 7519 W Oralee Ln
- 7534 W Oralee Ln
- 7527 W Oralee Ln
- 7511 W Oralee Ln
- 7494 W Oralee Ln
- 7503 W Oralee Ln
- 1369 N Oralee Ln
- 1377 N Oralee Ln
- 1385 N Oralee Ln
- 7741 Willow Ln
- 7495 W Oralee Ln
- 7486 W Oralee Ln
- 7749 Willow Ln
- 1393 N Oralee Ln
- 7487 W Oralee Ln