Estimated Value: $243,950 - $254,000
3
Beds
2
Baths
1,119
Sq Ft
$223/Sq Ft
Est. Value
About This Home
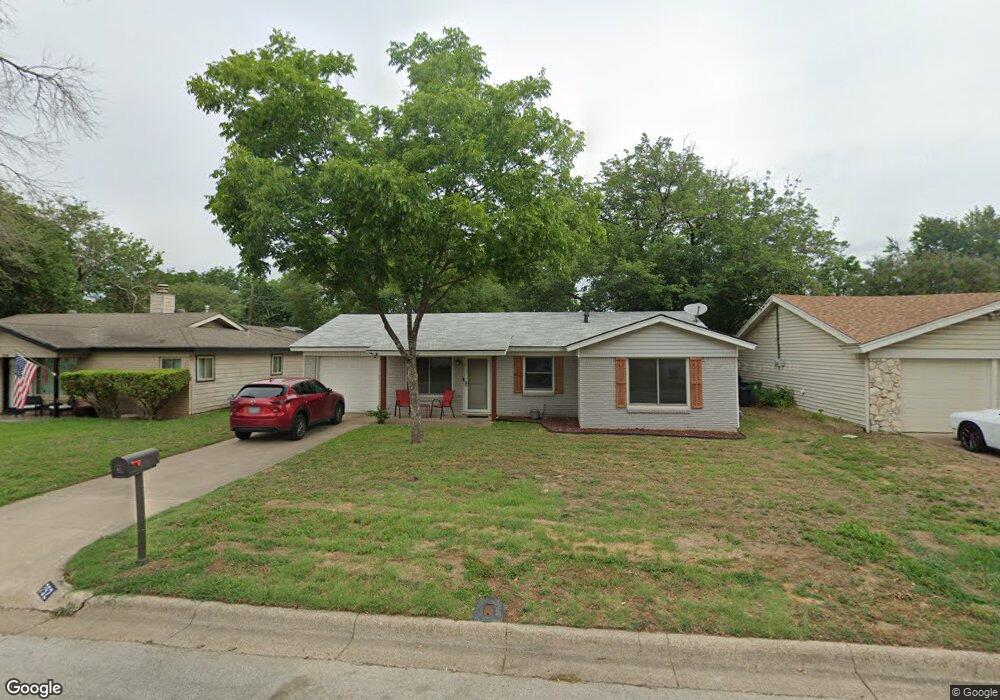
This home is located at 752 Betty Ln, Hurst, TX 76053 and is currently estimated at $248,988, approximately $222 per square foot. 752 Betty Ln is a home located in Tarrant County with nearby schools including West Hurst Elementary School, Hurst J High School, and L.D. Bell High School.
Ownership History
Date
Name
Owned For
Owner Type
Purchase Details
Closed on
May 23, 2017
Sold by
Fowler Robert K
Bought by
Flannagan Timothy J
Current Estimated Value
Home Financials for this Owner
Home Financials are based on the most recent Mortgage that was taken out on this home.
Original Mortgage
$148,000
Outstanding Balance
$123,013
Interest Rate
4.08%
Mortgage Type
New Conventional
Estimated Equity
$125,975
Purchase Details
Closed on
Jan 31, 2017
Sold by
Hfb Homes Llc
Bought by
Gmlt Holdings Llc
Purchase Details
Closed on
Jan 30, 2017
Sold by
Fowler Linda Lee
Bought by
Heb Homes Llc
Purchase Details
Closed on
Jun 28, 2005
Sold by
Fowler Linda Lee
Bought by
Fowler Linda Lee
Purchase Details
Closed on
Feb 28, 2000
Sold by
Fowler Linda Lee
Bought by
Fowler Linda Lee and Fowler Family Living Revocable Trust
Create a Home Valuation Report for This Property
The Home Valuation Report is an in-depth analysis detailing your home's value as well as a comparison with similar homes in the area
Home Values in the Area
Average Home Value in this Area
Purchase History
| Date | Buyer | Sale Price | Title Company |
|---|---|---|---|
| Flannagan Timothy J | -- | None Available | |
| Gmlt Holdings Llc | -- | Alamo Title | |
| Heb Homes Llc | -- | None Available | |
| Fowler Linda Lee | -- | Fidelity Natl Title | |
| Fowler Linda Lee | -- | -- |
Source: Public Records
Mortgage History
| Date | Status | Borrower | Loan Amount |
|---|---|---|---|
| Open | Flannagan Timothy J | $148,000 |
Source: Public Records
Tax History Compared to Growth
Tax History
| Year | Tax Paid | Tax Assessment Tax Assessment Total Assessment is a certain percentage of the fair market value that is determined by local assessors to be the total taxable value of land and additions on the property. | Land | Improvement |
|---|---|---|---|---|
| 2025 | $3,307 | $224,000 | $60,000 | $164,000 |
| 2024 | $3,307 | $242,517 | $60,000 | $182,517 |
| 2023 | $4,262 | $268,275 | $30,000 | $238,275 |
| 2022 | $4,453 | $224,682 | $30,000 | $194,682 |
| 2021 | $4,240 | $187,846 | $30,000 | $157,846 |
| 2020 | $3,846 | $159,839 | $30,000 | $129,839 |
| 2019 | $3,912 | $159,839 | $30,000 | $129,839 |
| 2018 | $3,156 | $151,760 | $18,000 | $133,760 |
| 2017 | $2,052 | $119,650 | $18,000 | $101,650 |
| 2016 | $1,865 | $106,110 | $18,000 | $88,110 |
| 2015 | $662 | $67,000 | $12,000 | $55,000 |
| 2014 | $662 | $67,000 | $12,000 | $55,000 |
Source: Public Records
Map
Nearby Homes
- 808 Betty Ct
- 637 Post Oak Dr
- 408 Simmons Dr
- 741 Ponderosa Dr
- 425 Ridgecrest Dr
- 425 Moore Creek Rd
- 758 Briarwood Ln
- 756 Briarwood Ln
- 520 W Redbud Dr
- 744 Briarwood Ln
- 3216 Fountain Pkwy
- 405 Billy Creek Cir
- 628 Elm St
- 612 Elm St
- 125 Souder Dr
- 1112 Blakey Ct
- 516 Hurstview Dr
- 8736 Trinity Vista Trail
- 2967 Danube Ct
- 708 Hurstview Dr