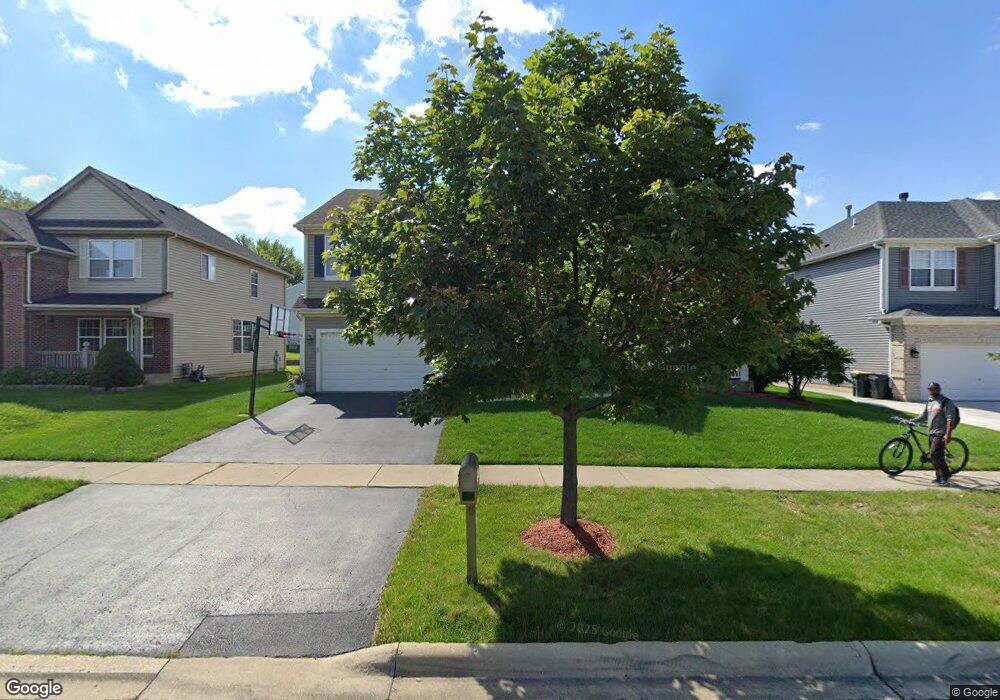
752 Castleton Ct Carol Stream, IL 60188
Estimated Value: $652,000 - $669,000
4
Beds
3
Baths
3,503
Sq Ft
$188/Sq Ft
Est. Value
About This Home
This home is located at 752 Castleton Ct, Carol Stream, IL 60188 and is currently estimated at $658,759, approximately $188 per square foot. 752 Castleton Ct is a home located in DuPage County with nearby schools including Roy De Shane Elementary School, Stratford Middle School, and Glenbard North High School.
Ownership History
Date
Name
Owned For
Owner Type
Purchase Details
Closed on
Mar 21, 2017
Sold by
Brown Troy and Brown Kelly
Bought by
Ramiro Norman R and Ramiro Sharon B
Current Estimated Value
Home Financials for this Owner
Home Financials are based on the most recent Mortgage that was taken out on this home.
Original Mortgage
$352,750
Outstanding Balance
$292,112
Interest Rate
4.12%
Mortgage Type
New Conventional
Estimated Equity
$366,647
Purchase Details
Closed on
Jun 22, 2000
Sold by
Drh Cambridge Homes Inc
Bought by
Brown Troy and Brown Kelly
Home Financials for this Owner
Home Financials are based on the most recent Mortgage that was taken out on this home.
Original Mortgage
$252,700
Interest Rate
8.31%
Create a Home Valuation Report for This Property
The Home Valuation Report is an in-depth analysis detailing your home's value as well as a comparison with similar homes in the area
Home Values in the Area
Average Home Value in this Area
Purchase History
| Date | Buyer | Sale Price | Title Company |
|---|---|---|---|
| Ramiro Norman R | $415,000 | Greater Illinois Title | |
| Brown Troy | $339,500 | First American Title |
Source: Public Records
Mortgage History
| Date | Status | Borrower | Loan Amount |
|---|---|---|---|
| Open | Ramiro Norman R | $352,750 | |
| Previous Owner | Brown Troy | $252,700 | |
| Closed | Brown Troy | $18,560 |
Source: Public Records
Tax History
| Year | Tax Paid | Tax Assessment Tax Assessment Total Assessment is a certain percentage of the fair market value that is determined by local assessors to be the total taxable value of land and additions on the property. | Land | Improvement |
|---|---|---|---|---|
| 2024 | $15,298 | $186,371 | $43,901 | $142,470 |
| 2023 | $14,400 | $169,090 | $39,830 | $129,260 |
| 2022 | $13,946 | $157,150 | $37,020 | $120,130 |
| 2021 | $13,303 | $149,180 | $35,140 | $114,040 |
| 2020 | $13,024 | $144,710 | $34,090 | $110,620 |
| 2019 | $12,553 | $139,540 | $32,870 | $106,670 |
| 2018 | $11,826 | $133,530 | $31,450 | $102,080 |
| 2017 | $12,569 | $138,330 | $30,200 | $108,130 |
| 2016 | $13,025 | $139,010 | $28,850 | $110,160 |
| 2015 | $12,949 | $131,590 | $27,310 | $104,280 |
| 2014 | $12,821 | $128,260 | $26,620 | $101,640 |
| 2013 | $12,736 | $131,330 | $27,260 | $104,070 |
Source: Public Records
Map
Nearby Homes
- 554 Alton Ct Unit 224
- 553 Alton Ct Unit 2113
- 545 Alton Ct Unit 273
- 514 Alton Ct Unit 2
- 770 Birchbark Trail
- 761 Colorado Ct Unit 2241
- 517 Danbury Dr
- 766 Colorado Ct Unit 2293
- 734 Colorado Ct Unit 734
- 454 Esselen Ct Unit 2
- 880 Hampton Dr
- 648 Thunderbird Trail
- 27W270 Jefferson St
- 862 Omaha Ct
- 1116 Evergreen Dr
- 909 Hampton Dr
- 1060 Cliff View Ln
- 27W046 North Ave
- 403 Arrowhead Trail
- 736 Cypress Ln
- 748 Castleton Ct
- 756 Castleton Ct
- 653 Tahoe Ct
- 744 Castleton Ct
- 760 Castleton Ct
- 647 Tahoe Ct
- 642 Tahoe Ct Unit 4
- 643 Tahoe Ct
- 740 Castleton Ct
- 766 Castleton Ct
- 650 Tacoma Dr
- 637 Tahoe Ct
- 638 Tahoe Ct
- 664 Tacoma Dr
- 644 Tacoma Dr
- 633 Tahoe Ct
- 632 Tahoe Ct
- 770 Castleton Ct
- 767 Castleton Ct
- 640 Tacoma Dr
Your Personal Tour Guide
Ask me questions while you tour the home.