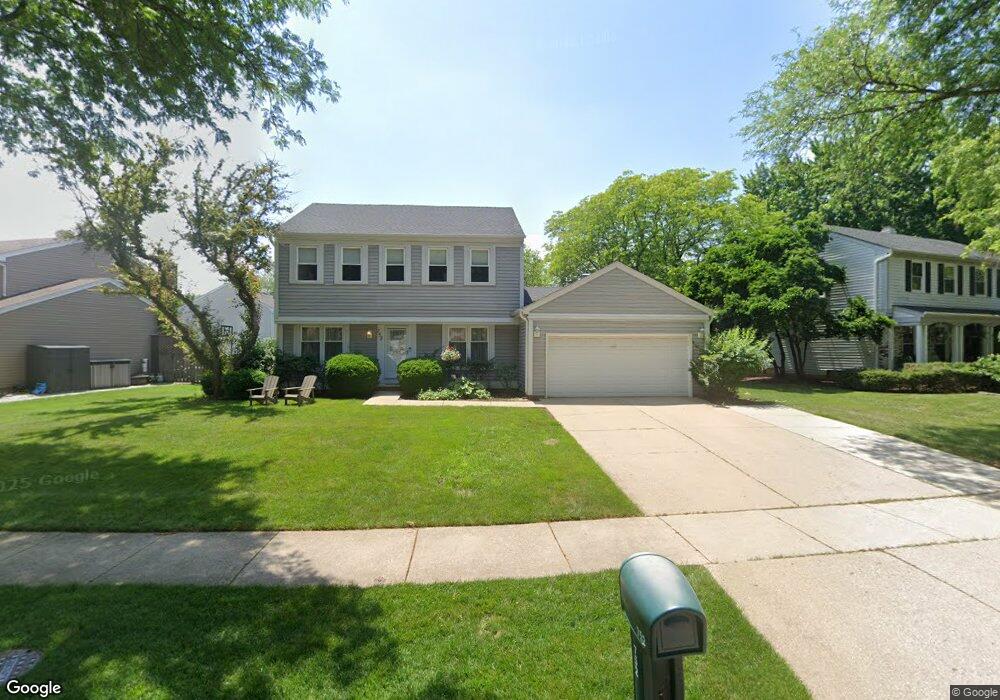
752 Chaucer Way Buffalo Grove, IL 60089
Prairie Park-Lake County NeighborhoodEstimated Value: $565,439 - $599,000
--
Bed
3
Baths
2,080
Sq Ft
$279/Sq Ft
Est. Value
About This Home
This home is located at 752 Chaucer Way, Buffalo Grove, IL 60089 and is currently estimated at $579,360, approximately $278 per square foot. 752 Chaucer Way is a home located in Lake County with nearby schools including Prairie Elementary School, Twin Groves Middle School, and Adlai E Stevenson High School.
Ownership History
Date
Name
Owned For
Owner Type
Purchase Details
Closed on
Oct 12, 2001
Sold by
Greene Dennis E and Greene Lynn R
Bought by
Becker David L and Becker Faith S
Current Estimated Value
Home Financials for this Owner
Home Financials are based on the most recent Mortgage that was taken out on this home.
Original Mortgage
$235,000
Outstanding Balance
$91,382
Interest Rate
6.8%
Estimated Equity
$487,978
Purchase Details
Closed on
Jul 8, 1994
Sold by
Shack Ernest and Shack Susan
Bought by
Greene Dennis E and Greene Lynn R
Home Financials for this Owner
Home Financials are based on the most recent Mortgage that was taken out on this home.
Original Mortgage
$180,000
Interest Rate
7.5%
Create a Home Valuation Report for This Property
The Home Valuation Report is an in-depth analysis detailing your home's value as well as a comparison with similar homes in the area
Home Values in the Area
Average Home Value in this Area
Purchase History
| Date | Buyer | Sale Price | Title Company |
|---|---|---|---|
| Becker David L | $365,500 | -- | |
| Greene Dennis E | $227,000 | Chicago Title Insurance Co |
Source: Public Records
Mortgage History
| Date | Status | Borrower | Loan Amount |
|---|---|---|---|
| Open | Becker David L | $235,000 | |
| Previous Owner | Greene Dennis E | $180,000 |
Source: Public Records
Tax History Compared to Growth
Tax History
| Year | Tax Paid | Tax Assessment Tax Assessment Total Assessment is a certain percentage of the fair market value that is determined by local assessors to be the total taxable value of land and additions on the property. | Land | Improvement |
|---|---|---|---|---|
| 2024 | $14,556 | $166,812 | $40,231 | $126,581 |
| 2023 | $13,402 | $149,904 | $36,153 | $113,751 |
| 2022 | $13,402 | $134,524 | $32,444 | $102,080 |
| 2021 | $12,894 | $133,073 | $32,094 | $100,979 |
| 2020 | $12,590 | $133,527 | $32,203 | $101,324 |
| 2019 | $12,417 | $133,034 | $32,084 | $100,950 |
| 2018 | $11,830 | $130,887 | $31,709 | $99,178 |
| 2017 | $11,606 | $127,832 | $30,969 | $96,863 |
| 2016 | $11,303 | $122,409 | $29,655 | $92,754 |
| 2015 | $11,003 | $114,476 | $27,733 | $86,743 |
| 2014 | $10,445 | $107,486 | $29,785 | $77,701 |
| 2012 | $10,359 | $107,702 | $29,845 | $77,857 |
Source: Public Records
Map
Nearby Homes
- 1315 Gail Dr
- 1327 Larchmont Dr
- 531 Lasalle Ln
- 1027 Courtland Dr Unit 20
- 810 Silver Rock Ln
- 5107 N Arlington Heights Rd
- 760 Checker Dr
- 12 Cloverdale Ct
- 5135 Bridlewood Ct
- 620 Twisted Oak Ln
- 938 Hidden Lake Dr
- 1325 Fairfax Ln
- 1117 Franklin Ln Unit C52
- 1272 Sandhurst Dr
- 630 Woodhollow Ln
- 131 Autumn Ct Unit CT10602
- 5255 Danbury Ct
- 268 Hoffmann Dr
- 2015 Tree Farm Ct
- 4106 Bob o Link Ln
- 764 Chaucer Way
- 740 Chaucer Way
- 1298 Brandywyn Ln
- 776 Chaucer Way
- 1265 Devonshire Rd
- 753 Chaucer Way Unit 2
- 765 Chaucer Way Unit 2
- 1261 Devonshire Rd
- 741 Chaucer Way
- 1331 Kent Ln
- 729 Chaucer Way
- 1284 Brandywyn Ln
- 788 Chaucer Way
- 1269 Devonshire Rd
- 1257 Devonshire Rd
- 750 Thompson Blvd
- 1285 Brandywyn Ln
- 1351 Kent Ln
- 1275 Devonshire Rd
- 1270 Brandywyn Ln