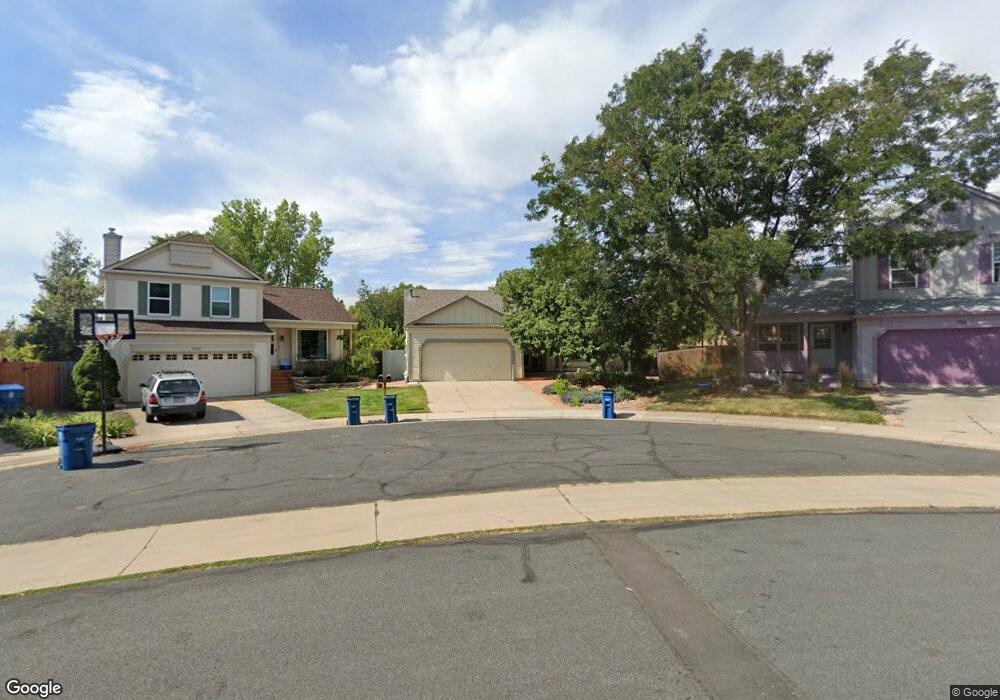
752 W Hemlock Cir Louisville, CO 80027
Estimated Value: $844,108 - $1,028,000
3
Beds
3
Baths
1,500
Sq Ft
$607/Sq Ft
Est. Value
About This Home
This home is located at 752 W Hemlock Cir, Louisville, CO 80027 and is currently estimated at $911,027, approximately $607 per square foot. 752 W Hemlock Cir is a home located in Boulder County with nearby schools including Fireside Elementary School, Monarch K-8 School, and Monarch High School.
Ownership History
Date
Name
Owned For
Owner Type
Purchase Details
Closed on
Sep 29, 2025
Sold by
Radley William S and Radley Martin R
Bought by
Marwill Group Llc
Current Estimated Value
Purchase Details
Closed on
Sep 16, 2025
Sold by
Radley William S and Radley William Stuart
Bought by
William S Radley Trust and Radley
Purchase Details
Closed on
Oct 5, 2022
Sold by
Margaret Radley Irrevocable Trust
Bought by
Radley William S and Radley Martin R
Purchase Details
Closed on
Oct 11, 2005
Sold by
Radley Margareth
Bought by
The Margareth Radley Irrevocable Trust
Purchase Details
Closed on
Sep 3, 1992
Bought by
Radley Margaret Irrevocable Trust
Purchase Details
Closed on
Aug 14, 1992
Bought by
Radley Margaret Irrevocable Trust
Purchase Details
Closed on
Mar 18, 1991
Bought by
Radley Margaret Irrevocable Trust
Purchase Details
Closed on
Nov 6, 1987
Bought by
Radley Margaret Irrevocable Trust
Create a Home Valuation Report for This Property
The Home Valuation Report is an in-depth analysis detailing your home's value as well as a comparison with similar homes in the area
Home Values in the Area
Average Home Value in this Area
Purchase History
| Date | Buyer | Sale Price | Title Company |
|---|---|---|---|
| Marwill Group Llc | -- | None Listed On Document | |
| William S Radley Trust | -- | None Listed On Document | |
| Radley William S | -- | -- | |
| The Margareth Radley Irrevocable Trust | -- | -- | |
| Radley Margaret Irrevocable Trust | -- | -- | |
| Radley Margaret Irrevocable Trust | -- | -- | |
| Radley Margaret Irrevocable Trust | -- | -- | |
| Radley Margaret Irrevocable Trust | $108,700 | -- |
Source: Public Records
Tax History Compared to Growth
Tax History
| Year | Tax Paid | Tax Assessment Tax Assessment Total Assessment is a certain percentage of the fair market value that is determined by local assessors to be the total taxable value of land and additions on the property. | Land | Improvement |
|---|---|---|---|---|
| 2025 | $5,156 | $58,825 | $24,369 | $34,456 |
| 2024 | $5,156 | $58,825 | $24,369 | $34,456 |
| 2023 | $5,069 | $57,365 | $26,378 | $34,673 |
| 2022 | $3,606 | $44,417 | $19,974 | $24,443 |
| 2021 | $3,792 | $48,098 | $21,629 | $26,469 |
| 2020 | $3,279 | $42,186 | $18,376 | $23,810 |
| 2019 | $3,232 | $42,186 | $18,376 | $23,810 |
| 2018 | $2,868 | $39,298 | $9,000 | $30,298 |
| 2017 | $2,811 | $43,446 | $9,950 | $33,496 |
| 2016 | $2,278 | $33,854 | $13,612 | $20,242 |
| 2015 | $2,159 | $30,105 | $16,557 | $13,548 |
| 2014 | $1,893 | $30,105 | $16,557 | $13,548 |
Source: Public Records
Map
Nearby Homes
- 118 S Tanager Ct
- 494 Owl Dr Unit 4
- 812 W Mulberry St
- 408 Fillmore Ct
- 810 Trail Ridge Dr
- 159 S Polk Ave
- 823 Trail Ridge Dr
- 900 Eldorado Ln
- 848 Trail Ridge Dr
- 641 W Dahlia St
- 592 Spruce Cir
- 593 Wildrose Way
- 279 S Taft Ct Unit 53
- 958 Eldorado Ln
- 323 S Taft Ct Unit 26
- 305 S Taft Ct Unit 33
- 955 Arapahoe Cir
- 284 S Taft Ct Unit 76
- 1006 Honeysuckle Ln
- 362 S Taft Ct Unit 108
- 750 W Hemlock Cir
- 754 W Hemlock Cir
- 748 W Hemlock Cir
- 756 W Hemlock Cir
- 740 W Hemlock Cir
- 791 W Mulberry St
- 777 W Mulberry St
- 762 W Hemlock Cir
- 736 W Hemlock Cir
- 801 W Mulberry St
- 763 W Mulberry St
- 739 W Hemlock Cir
- 771 W Hemlock Cir
- 768 W Hemlock Cir
- 803 W Mulberry St
- 732 W Hemlock Cir
- 757 W Mulberry St
- 723 W Hemlock Cir
- 787 W Hemlock Cir
- 107 S Tanager Ct