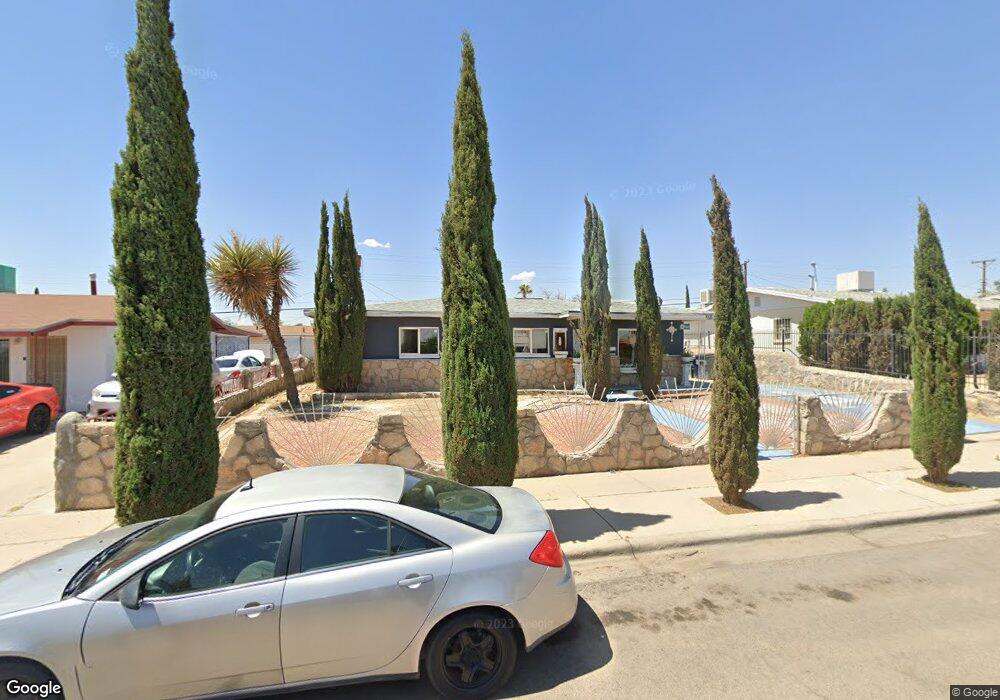
7521 Benson Dr Unit na El Paso, TX 79915
Ranchland East NeighborhoodEstimated Value: $157,000 - $181,000
3
Beds
2
Baths
1,216
Sq Ft
$141/Sq Ft
Est. Value
About This Home
This home is located at 7521 Benson Dr Unit na, El Paso, TX 79915 and is currently estimated at $171,334, approximately $140 per square foot. 7521 Benson Dr Unit na is a home located in El Paso County with nearby schools including Bel Air Middle, Bel Air High School, and Ramona STEM Academy.
Ownership History
Date
Name
Owned For
Owner Type
Purchase Details
Closed on
May 10, 2024
Sold by
Pineda Marco Antonio and Munoz Rosa Velia
Bought by
Aguilar Kevin Roberto
Current Estimated Value
Purchase Details
Closed on
Dec 7, 2023
Sold by
Flores Sagrario
Bought by
Pineda Marco Antonio and Munoz Rosa Velia
Purchase Details
Closed on
Feb 27, 2015
Sold by
Flores Andrew and Flores Oscar
Bought by
Flores Andres B and Flores Sagrario
Purchase Details
Closed on
Aug 15, 2014
Sold by
Sandoval Bernardo
Bought by
Flores Andres B and Flores Sagrario
Purchase Details
Closed on
May 1, 2010
Sold by
Flores Andres B
Bought by
Flores Andres B and Sandoval Bernardo
Purchase Details
Closed on
Jul 24, 2006
Sold by
Flores Andres B
Bought by
Andres B Flores Revocable Trust
Create a Home Valuation Report for This Property
The Home Valuation Report is an in-depth analysis detailing your home's value as well as a comparison with similar homes in the area
Home Values in the Area
Average Home Value in this Area
Purchase History
| Date | Buyer | Sale Price | Title Company |
|---|---|---|---|
| Aguilar Kevin Roberto | -- | None Listed On Document | |
| Aguilar Kevin Roberto | -- | None Listed On Document | |
| Pineda Marco Antonio | -- | None Listed On Document | |
| Pineda Marco Antonio | -- | None Listed On Document | |
| Flores Andres B | -- | None Available | |
| Flores Andres B | -- | None Available | |
| Flores Andres B | -- | None Available | |
| Flores Andres B | -- | None Available | |
| Flores Andres B | -- | None Available | |
| Flores Andres B | -- | None Available | |
| Andres B Flores Revocable Trust | -- | None Available | |
| Andres B Flores Revocable Trust | -- | None Available |
Source: Public Records
Tax History Compared to Growth
Tax History
| Year | Tax Paid | Tax Assessment Tax Assessment Total Assessment is a certain percentage of the fair market value that is determined by local assessors to be the total taxable value of land and additions on the property. | Land | Improvement |
|---|---|---|---|---|
| 2025 | $1,523 | $151,504 | $33,787 | $117,717 |
| 2024 | $1,523 | $132,148 | $14,431 | $117,717 |
| 2023 | $3,814 | $131,052 | $14,431 | $116,621 |
| 2022 | $3,421 | $110,169 | $14,431 | $95,738 |
| 2021 | $2,833 | $87,169 | $14,431 | $72,738 |
| 2020 | $2,617 | $82,849 | $14,431 | $68,418 |
| 2018 | $2,637 | $84,810 | $14,431 | $70,379 |
| 2017 | $2,410 | $78,840 | $14,431 | $64,409 |
| 2016 | $2,410 | $78,840 | $14,431 | $64,409 |
| 2015 | $2,288 | $78,840 | $14,431 | $64,409 |
| 2014 | $2,288 | $79,967 | $14,431 | $65,536 |
Source: Public Records
Map
Nearby Homes
- 1124 Hunter Dr
- 1121 Belen Rd
- 7403 Mojave Dr
- 7315 Mojave Dr
- 7564 Matamoros Dr
- 7534 Taxco Dr
- 7622 Matamoros Dr
- 1207 Bois d Arc Dr
- 7204 Benson Dr
- 7761 Maverick Ave
- 9525 Desert Ridge Dr
- 7713 Matamoros Dr
- 7542 Hermosillo Dr
- 7718 Parral Dr
- 7921 Candlewood Ave
- 7832 Ranchland Dr
- 10212 Garwood Ct
- 9801 Eastridge Dr
- 7936 Dogwood St
- 15161 Target Ave