Estimated Value: $303,000 - $337,000
3
Beds
3
Baths
1,697
Sq Ft
$187/Sq Ft
Est. Value
About This Home
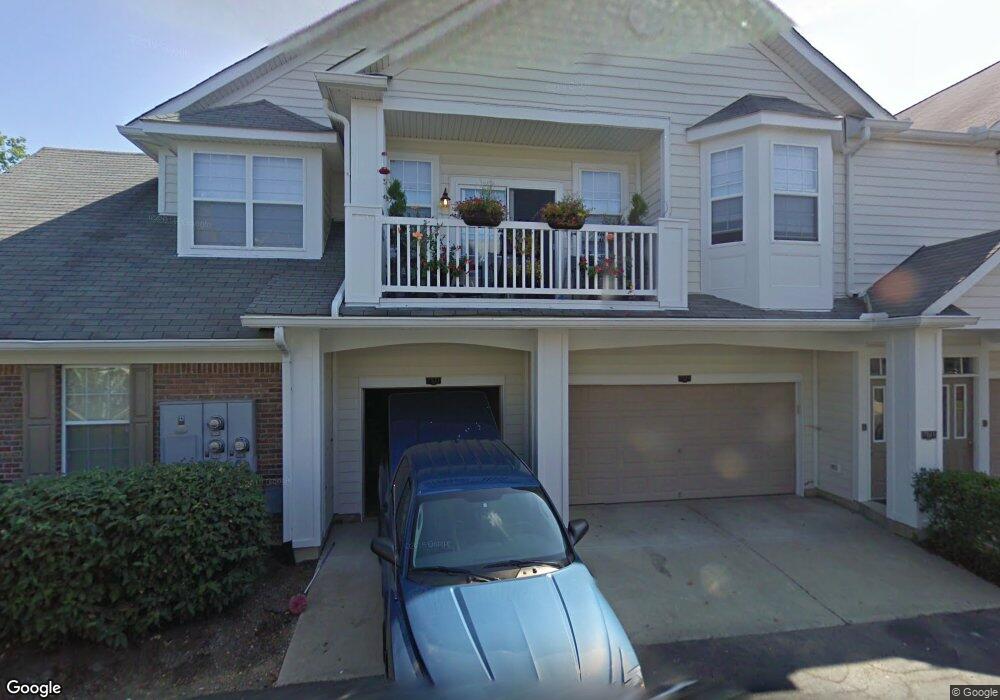
This home is located at 7521 Mansion Cir Unit D, Mason, OH 45040 and is currently estimated at $316,970, approximately $186 per square foot. 7521 Mansion Cir Unit D is a home located in Warren County with nearby schools including Mason Intermediate Elementary School, Mason Middle School, and William Mason High School.
Ownership History
Date
Name
Owned For
Owner Type
Purchase Details
Closed on
Sep 9, 2005
Sold by
Raitz Kimberly M and Raitz Kevin J
Bought by
Williams Duane
Current Estimated Value
Home Financials for this Owner
Home Financials are based on the most recent Mortgage that was taken out on this home.
Original Mortgage
$152,000
Outstanding Balance
$81,729
Interest Rate
5.93%
Mortgage Type
FHA
Estimated Equity
$235,241
Purchase Details
Closed on
Oct 27, 2000
Sold by
Yearout John
Bought by
Clift Kimberly M
Home Financials for this Owner
Home Financials are based on the most recent Mortgage that was taken out on this home.
Original Mortgage
$132,250
Interest Rate
7.9%
Mortgage Type
FHA
Purchase Details
Closed on
Jan 28, 1999
Sold by
Towne Dev Group Ltd
Bought by
Yearout John A and Yearout Elizabeth A
Home Financials for this Owner
Home Financials are based on the most recent Mortgage that was taken out on this home.
Original Mortgage
$147,611
Interest Rate
6.75%
Mortgage Type
New Conventional
Create a Home Valuation Report for This Property
The Home Valuation Report is an in-depth analysis detailing your home's value as well as a comparison with similar homes in the area
Home Values in the Area
Average Home Value in this Area
Purchase History
| Date | Buyer | Sale Price | Title Company |
|---|---|---|---|
| Williams Duane | $155,500 | First Title | |
| Clift Kimberly M | $142,250 | -- | |
| Yearout John A | $155,380 | -- |
Source: Public Records
Mortgage History
| Date | Status | Borrower | Loan Amount |
|---|---|---|---|
| Open | Williams Duane | $152,000 | |
| Previous Owner | Clift Kimberly M | $132,250 | |
| Previous Owner | Yearout John A | $147,611 |
Source: Public Records
Tax History Compared to Growth
Tax History
| Year | Tax Paid | Tax Assessment Tax Assessment Total Assessment is a certain percentage of the fair market value that is determined by local assessors to be the total taxable value of land and additions on the property. | Land | Improvement |
|---|---|---|---|---|
| 2024 | $3,515 | $82,620 | $24,500 | $58,120 |
| 2023 | $3,162 | $62,352 | $10,762 | $51,590 |
| 2022 | $3,162 | $62,353 | $10,763 | $51,590 |
| 2021 | $3,007 | $62,353 | $10,763 | $51,590 |
| 2020 | $2,878 | $50,694 | $8,750 | $41,944 |
| 2019 | $2,666 | $50,694 | $8,750 | $41,944 |
| 2018 | $2,677 | $50,694 | $8,750 | $41,944 |
| 2017 | $2,327 | $40,653 | $6,703 | $33,950 |
| 2016 | $2,392 | $40,653 | $6,703 | $33,950 |
| 2015 | $2,398 | $40,653 | $6,703 | $33,950 |
| 2014 | $2,319 | $36,300 | $5,990 | $30,310 |
| 2013 | $2,324 | $53,070 | $8,750 | $44,320 |
Source: Public Records
Map
Nearby Homes
- 7489 Mansion Cir
- 7601 Mansion Cir
- 7609 Mansion Cir
- 4320 Crystal Ct
- 4251 S Shore Dr
- 4344 N Point Dr
- 4321 N Shore Dr
- 4344 N Point Ct Unit 202
- 4344 North Point
- 7754 Cove View Dr
- 4451 N Shore Dr
- 4027 Meadow Grove Ln
- 4487 N Shore Dr
- 4379 English Oak Ct Unit 38302
- 4431 English Oak Ct
- 4467 English Oak Ct
- 7362 Middleton Way
- 4465 Black Oak Ln
- 7826 Columbia Rd
- 4447 Hyacinth Dr
- 7521 Mansion Cir Unit F
- 7521 Mansion Cir Unit E
- 7521 Mansion Cir Unit C
- 7521 Mansion Cir Unit B
- 7521 Mansion Cir Unit A
- 7521 Mansion Cir
- C Mansion Cir
- 4004 S Shore Dr
- 7545 Mansion Cir
- 7545 Mansion Cir Unit F
- 7545 Mansion Cir Unit E
- 7545 Mansion Cir Unit D
- 7545 Mansion Cir Unit C
- 7545 Mansion Cir Unit B
- 7545 Mansion Cir Unit A
- 7492 Mansion Cir Unit F
- 7492 Mansion Cir Unit E
- 7492 Mansion Cir Unit D
- 7492 Mansion Cir Unit C
- 7492 Mansion Cir Unit B