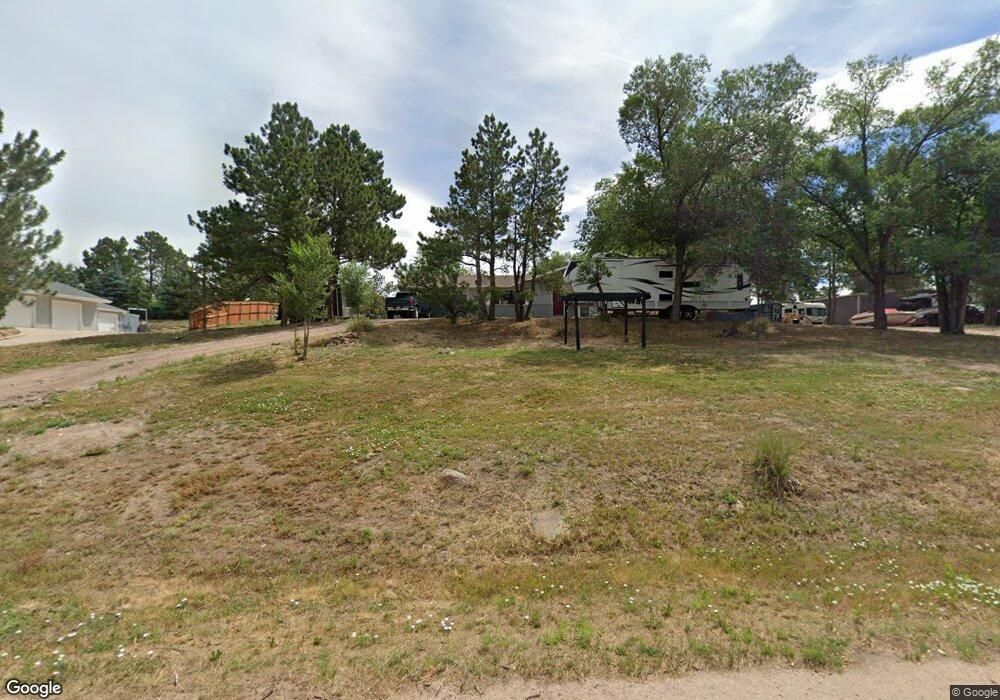
7521 Tudor Rd Colorado Springs, CO 80919
Estimated Value: $535,318 - $661,000
3
Beds
1
Bath
1,176
Sq Ft
$516/Sq Ft
Est. Value
About This Home
This home is located at 7521 Tudor Rd, Colorado Springs, CO 80919 and is currently estimated at $606,580, approximately $515 per square foot. 7521 Tudor Rd is a home located in El Paso County with nearby schools including Woodmen-Roberts Elementary School, Eagleview Middle School, and Air Academy High School.
Ownership History
Date
Name
Owned For
Owner Type
Purchase Details
Closed on
Mar 13, 2020
Sold by
Grimm Sandra
Bought by
Grimm Sophia and Grimm Henri Louis
Current Estimated Value
Purchase Details
Closed on
Nov 13, 2015
Sold by
Grimm Steffen and Grimm Sandra
Bought by
Grimm Sandra
Purchase Details
Closed on
Jun 17, 2011
Sold by
Moberly Raymond L and Moberly Lily H
Bought by
Grimm Steffen and Grimm Sandra
Home Financials for this Owner
Home Financials are based on the most recent Mortgage that was taken out on this home.
Original Mortgage
$170,000
Outstanding Balance
$115,754
Interest Rate
4.37%
Mortgage Type
Adjustable Rate Mortgage/ARM
Estimated Equity
$490,826
Purchase Details
Closed on
Nov 17, 1993
Sold by
Moberly Raymond L
Bought by
Moberly Raymond L and Moberly Lily H
Purchase Details
Closed on
Jul 24, 1991
Bought by
Grimm Sandra
Purchase Details
Closed on
May 1, 1985
Bought by
Grimm Sandra
Purchase Details
Closed on
Jul 1, 1983
Bought by
Grimm Sandra
Create a Home Valuation Report for This Property
The Home Valuation Report is an in-depth analysis detailing your home's value as well as a comparison with similar homes in the area
Home Values in the Area
Average Home Value in this Area
Purchase History
| Date | Buyer | Sale Price | Title Company |
|---|---|---|---|
| Grimm Sophia | -- | None Available | |
| Grimm Sandra | -- | None Available | |
| Grimm Steffen | $240,000 | None Available | |
| Moberly Raymond L | -- | -- | |
| Grimm Sandra | -- | -- | |
| Grimm Sandra | -- | -- | |
| Grimm Sandra | -- | -- |
Source: Public Records
Mortgage History
| Date | Status | Borrower | Loan Amount |
|---|---|---|---|
| Open | Grimm Steffen | $170,000 |
Source: Public Records
Tax History Compared to Growth
Tax History
| Year | Tax Paid | Tax Assessment Tax Assessment Total Assessment is a certain percentage of the fair market value that is determined by local assessors to be the total taxable value of land and additions on the property. | Land | Improvement |
|---|---|---|---|---|
| 2025 | $2,031 | $41,130 | -- | -- |
| 2024 | $1,986 | $35,250 | $7,230 | $28,020 |
| 2023 | $1,986 | $35,250 | $7,230 | $28,020 |
| 2022 | $2,216 | $31,470 | $6,000 | $25,470 |
| 2021 | $2,453 | $32,380 | $6,170 | $26,210 |
| 2020 | $1,968 | $24,350 | $5,360 | $18,990 |
| 2019 | $1,949 | $24,350 | $5,360 | $18,990 |
| 2018 | $1,728 | $21,250 | $4,320 | $16,930 |
| 2017 | $1,722 | $21,250 | $4,320 | $16,930 |
| 2016 | $1,720 | $21,200 | $3,980 | $17,220 |
| 2015 | $1,717 | $21,200 | $3,980 | $17,220 |
| 2014 | $1,563 | $19,280 | $3,820 | $15,460 |
Source: Public Records
Map
Nearby Homes
- 420 Woodmen Ct
- 7345 Woodmen Mesa Cir
- 7615 Winding Oaks Dr
- 5 Cap Rock Way
- 10 Cap Rock Way
- 866 Venhorst Rd
- 45 E Woodmen Rd
- 87 Raven Hills Ct
- 6946 Gayle Lyn Ln Unit 6946
- 158 Buckeye Dr
- 6840 Goldcrest Ct Unit 170
- 6737 Overland Dr Unit 197
- 6719 Overland Dr
- 421 Ravenview Ct
- 6820 Dauntless Ct
- 45 Gold Coin Ct
- 6648 Overland Dr Unit 237
- 512 Rolling Hills Dr Unit 138
- 6831 Mountain Top Ln Unit 78
- 1160 Berglind Rd