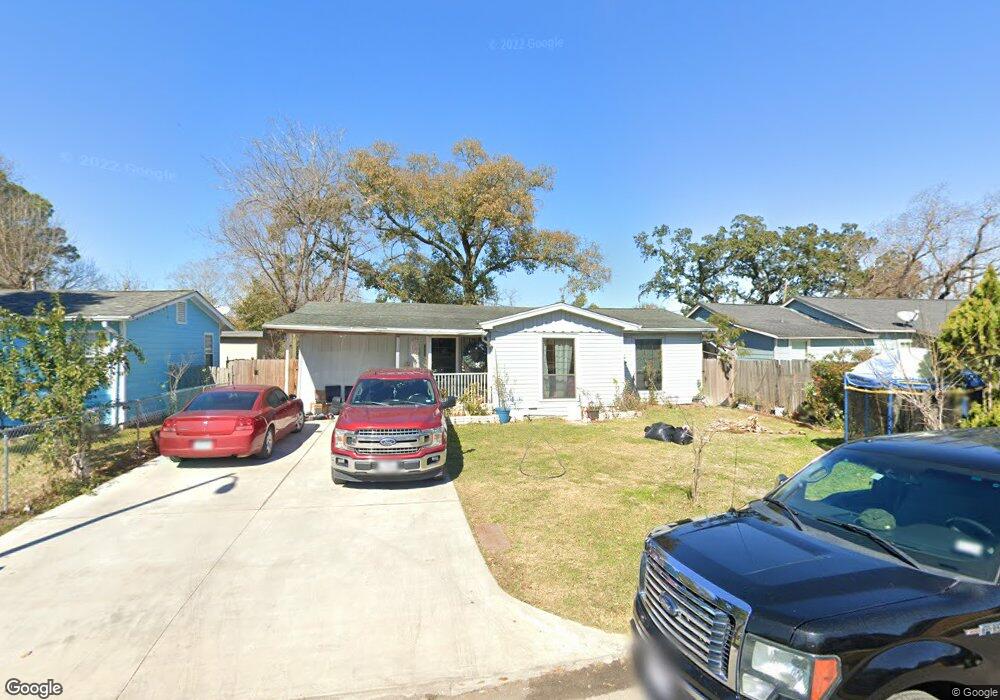
7523 Greendowns St Houston, TX 77087
Golfcrest-Bellfort-Reveille NeighborhoodEstimated Value: $169,953 - $234,000
2
Beds
1
Bath
1,234
Sq Ft
$168/Sq Ft
Est. Value
About This Home
This home is located at 7523 Greendowns St, Houston, TX 77087 and is currently estimated at $207,738, approximately $168 per square foot. 7523 Greendowns St is a home located in Harris County with nearby schools including Golfcrest Elementary School, Hartman Middle School, and Ross Shaw Sterling Aviation High School.
Ownership History
Date
Name
Owned For
Owner Type
Purchase Details
Closed on
Apr 16, 2019
Sold by
Casillas Felipe
Bought by
Rivera Francisco and Casillas Jessica
Current Estimated Value
Purchase Details
Closed on
Sep 6, 2000
Sold by
Smith Beckwith Dixon
Bought by
Eastham Margaret Tavenner and Smith Margaret Eastham
Purchase Details
Closed on
Jul 31, 1998
Sold by
Hud
Bought by
Casillas Felipe
Home Financials for this Owner
Home Financials are based on the most recent Mortgage that was taken out on this home.
Original Mortgage
$35,625
Outstanding Balance
$7,445
Interest Rate
6.94%
Estimated Equity
$200,293
Purchase Details
Closed on
Dec 2, 1997
Sold by
Alliance Mtg Company
Bought by
Hud
Purchase Details
Closed on
Jul 30, 1993
Sold by
Ellis Freddie J and Ellis Carolyn A
Create a Home Valuation Report for This Property
The Home Valuation Report is an in-depth analysis detailing your home's value as well as a comparison with similar homes in the area
Home Values in the Area
Average Home Value in this Area
Purchase History
| Date | Buyer | Sale Price | Title Company |
|---|---|---|---|
| Rivera Francisco | -- | None Available | |
| Eastham Margaret Tavenner | -- | -- | |
| Casillas Felipe | $37,500 | American Title Co | |
| Hud | -- | -- | |
| Alliance Mtg Company | $22,429 | -- | |
| -- | -- | Charter Title Company |
Source: Public Records
Mortgage History
| Date | Status | Borrower | Loan Amount |
|---|---|---|---|
| Open | Casillas Felipe | $35,625 |
Source: Public Records
Tax History Compared to Growth
Tax History
| Year | Tax Paid | Tax Assessment Tax Assessment Total Assessment is a certain percentage of the fair market value that is determined by local assessors to be the total taxable value of land and additions on the property. | Land | Improvement |
|---|---|---|---|---|
| 2025 | $2,377 | $155,677 | $51,955 | $103,722 |
| 2024 | $2,377 | $149,183 | $45,461 | $103,722 |
| 2023 | $2,377 | $149,183 | $45,461 | $103,722 |
| 2022 | $3,162 | $143,599 | $45,461 | $98,138 |
| 2021 | $2,692 | $115,514 | $25,978 | $89,536 |
| 2020 | $2,236 | $92,347 | $16,236 | $76,111 |
| 2019 | $2,126 | $87,331 | $16,236 | $71,095 |
| 2018 | $1,252 | $76,365 | $16,236 | $60,129 |
| 2017 | $1,931 | $76,365 | $16,236 | $60,129 |
| 2016 | $1,919 | $76,365 | $16,236 | $60,129 |
| 2015 | $1,117 | $71,326 | $14,612 | $56,714 |
| 2014 | $1,117 | $62,716 | $14,612 | $48,104 |
Source: Public Records
Map
Nearby Homes
- 7507 Greenstone St
- 7546 Greendowns St
- 7543 Greenstone St
- 7393 Fairway Dr Unit B
- 7659 Greenstone St
- 3731 Reveille St
- 7703 Mchenry St
- 7318 Thurow St
- 3607 De Leon St
- 7337 Moline St
- 7309 Moline St
- 7313 Gulf Fwy Unit 814
- 7313 Gulf Fwy Unit 911
- 7313 Gulf Fwy Unit 1011
- 7303 Gulf Fwy Unit 903
- 7937 Grafton St
- 7022 Plum Creek Trail Ln
- 3408 Chaffin St
- 7734 El Rancho St
- 8023 Findlay St
- 7527 Greendowns St
- 7519 Greendowns St
- 7526 Mchenry St Unit 770
- 7522 Mchenry St
- 7530 Mchenry St
- 7531 Greendowns St
- 7526 Greendowns St
- 7522 Greendowns St
- 7536 Mchenry St
- 7501 Greendowns St
- 7530 Greendowns St
- 7535 Greendowns St
- 7518 Greendowns St
- 7534 Greendowns St Unit 770
- 7540 Mchenry St
- 7514 Greendowns St
- 7543 Greendowns St Unit 770
- 7538 Greendowns St
- 7523 Mchenry St
- 7527 Mchenry St