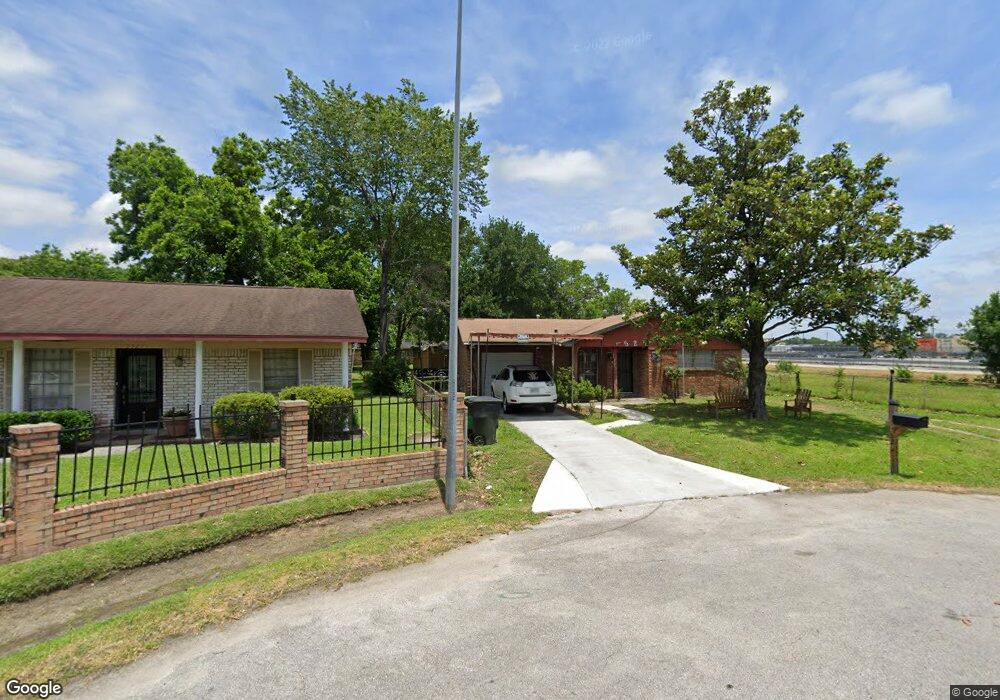
7525 Howton St Houston, TX 77028
Trinity-Houston Gardens NeighborhoodEstimated Value: $166,000 - $204,000
4
Beds
2
Baths
1,620
Sq Ft
$116/Sq Ft
Est. Value
About This Home
This home is located at 7525 Howton St, Houston, TX 77028 and is currently estimated at $188,266, approximately $116 per square foot. 7525 Howton St is a home located in Harris County with nearby schools including McGowen Elementary School, Key Middle, and Kashmere High School.
Ownership History
Date
Name
Owned For
Owner Type
Purchase Details
Closed on
Sep 17, 2011
Sold by
2011 Swe Homes Llc
Bought by
Cherry Tony B and Cherry Medella
Current Estimated Value
Home Financials for this Owner
Home Financials are based on the most recent Mortgage that was taken out on this home.
Original Mortgage
$60,350
Interest Rate
3.79%
Mortgage Type
Purchase Money Mortgage
Purchase Details
Closed on
Jul 7, 2011
Sold by
Citimortgage Inc
Bought by
2011 Swe Homes Llc
Purchase Details
Closed on
Mar 2, 2011
Sold by
Johnson Brenda R and Johnson Mike
Bought by
Citimortgage Inc
Purchase Details
Closed on
Jan 11, 1999
Sold by
Mcbride Ida Mae
Bought by
Johnson Mike and Johnson Brenda R
Home Financials for this Owner
Home Financials are based on the most recent Mortgage that was taken out on this home.
Original Mortgage
$44,625
Interest Rate
6.68%
Purchase Details
Closed on
Jun 11, 1997
Sold by
Mcbride Ida Mae Washington
Bought by
Simpson Earl
Create a Home Valuation Report for This Property
The Home Valuation Report is an in-depth analysis detailing your home's value as well as a comparison with similar homes in the area
Home Values in the Area
Average Home Value in this Area
Purchase History
| Date | Buyer | Sale Price | Title Company |
|---|---|---|---|
| Cherry Tony B | -- | None Available | |
| 2011 Swe Homes Llc | -- | First American Title | |
| Citimortgage Inc | $18,907 | None Available | |
| Johnson Mike | -- | Texas American Title Company | |
| Simpson Earl | -- | American Title Company |
Source: Public Records
Mortgage History
| Date | Status | Borrower | Loan Amount |
|---|---|---|---|
| Previous Owner | Cherry Tony B | $60,350 | |
| Previous Owner | Johnson Mike | $44,625 |
Source: Public Records
Tax History Compared to Growth
Tax History
| Year | Tax Paid | Tax Assessment Tax Assessment Total Assessment is a certain percentage of the fair market value that is determined by local assessors to be the total taxable value of land and additions on the property. | Land | Improvement |
|---|---|---|---|---|
| 2025 | $831 | $143,033 | $52,929 | $90,104 |
| 2024 | $831 | $156,946 | $52,929 | $104,017 |
| 2023 | $831 | $148,248 | $52,929 | $95,319 |
| 2022 | $1,539 | $109,875 | $28,714 | $81,161 |
| 2021 | $1,481 | $86,486 | $22,561 | $63,925 |
| 2020 | $1,399 | $72,700 | $13,947 | $58,753 |
| 2019 | $1,329 | $72,700 | $13,947 | $58,753 |
| 2018 | $833 | $32,909 | $8,822 | $24,087 |
| 2017 | $1,207 | $47,743 | $8,822 | $38,921 |
| 2016 | $657 | $26,000 | $5,734 | $20,266 |
| 2015 | $668 | $26,000 | $5,734 | $20,266 |
| 2014 | $668 | $26,000 | $5,734 | $20,266 |
Source: Public Records
Map
Nearby Homes
- 0 N Wayside Dr Unit 46613359
- 0 N Wayside Dr Unit 98122285
- 0 N Wayside Dr Unit ACT6956085
- 0 Blue St Unit 50257357
- 6920 Homestead Rd
- 5325 Yarmouth
- 0 N Wayside Dr Unit 54910598
- 0 Balfour Unit 51790448
- 7505 Jay St
- 7417 Miley St
- 7337 Howton St
- 7337 Miley St
- 7306 Saint Louis St
- 7713 Saint Louis St
- 0 Saint Louis St
- 7717 Saint Louis St
- 7963 Miley St
- 7123 Saint Louis St
- 0 Kellett St Unit 85066707
- 0 Glen Manor Dr Unit 10745202
- 7521 Howton St
- 7517 Howton St
- 7518 Saint Louis St
- 7522 Saint Louis St
- 7514 Saint Louis St
- 0 Jay But Off of Kirkpatrick St
- TR 24D Kirkpatrick Blvd
- 0 Kirkpatrick Blvd
- 7526 Saint Louis St
- 7513 Howton St
- 7510 Saint Louis St
- 7526 Howton St
- 7509 Howton St
- 7522 Howton St
- 7506 Saint Louis St
- 7518 Howton St
- 7505 Howton St
- 7517 Saint Louis St
- 7513 Saint Louis St
- 7509 Saint Louis St