

7525 Sanders Rd Rosharon, TX 77583
Estimated payment $2,428/month
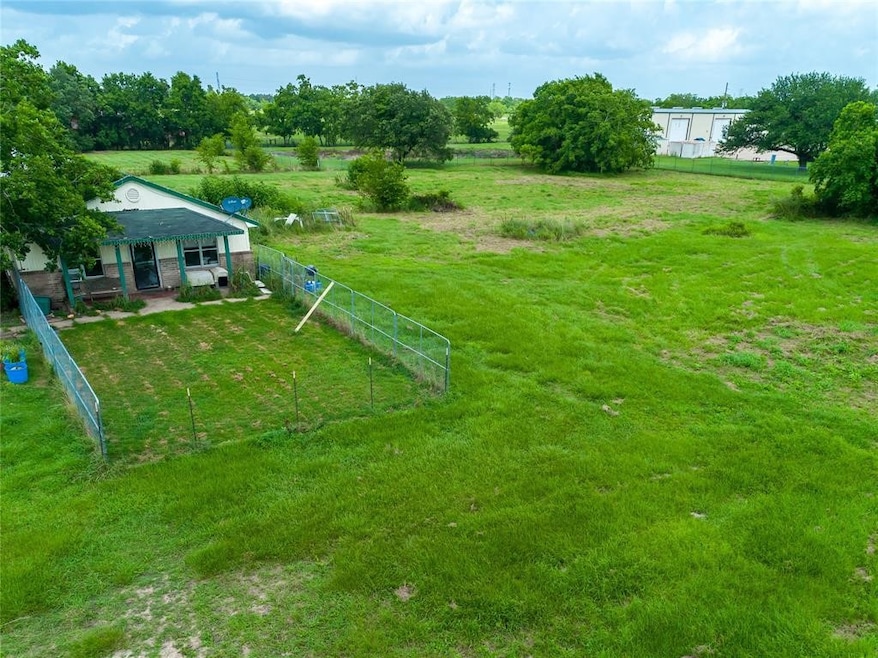
About This Lot
This is an Excellent Opportunity for a primary home buyer or investor Who Want to Make Quick Return, MAKE A MOVE!!! UNRESTRICTED LAND Great Opportunity,AS IS,WHERE IS. Multipurpose business, easy access to 288! AGGRESSIVE SELLER BRING ALL OFFERS
UNRESTRICTED LAND GATE CODE: 4331 KEYSAFE : NUMBER: 135 NO APPOINTMENT NEEDED
Hot Opportunities for business: PRIME LOCATION for Commercial Business Great for Bank, Fast Food, Gas Station, Offices, Stores, Party Halls etc. Onsite Detention NOT required Major intersection (Traffic Signal) Nice & Safe neighborhood PRICE NEGOTIABLE WITH SERIOUS BUYERS! AGGRESSIVE SELLER SEND ALL OFFERS IMMEDIATELY! BUYER MUST VERIFY BEFORE
Property Details
Property Type
- Land
Lot Details
- 2.61 Acre Lot
- May Be Possible The Lot Can Be Split Into 2+ Parcels
Schools
- Bennett Elementary School
- Caffey Junior High School
- Iowa Colony High School
Community Details
- Ht&Brr Subdivision
Map
Home Values in the Area
Average Home Value in this Area
Tax History
| Year | Tax Paid | Tax Assessment Tax Assessment Total Assessment is a certain percentage of the fair market value that is determined by local assessors to be the total taxable value of land and additions on the property. | Land | Improvement |
|---|---|---|---|---|
| 2025 | $3,947 | $245,070 | $172,050 | $73,020 |
| 2023 | $3,947 | $238,580 | $140,920 | $97,660 |
| 2022 | $3,422 | $161,490 | $94,850 | $66,640 |
| 2021 | $3,243 | $146,140 | $88,070 | $58,070 |
| 2020 | $3,147 | $140,180 | $81,300 | $58,880 |
| 2019 | $3,179 | $137,560 | $81,300 | $56,260 |
| 2018 | $2,969 | $149,710 | $81,300 | $68,410 |
| 2017 | $2,732 | $141,450 | $77,910 | $63,540 |
| 2016 | $2,650 | $112,990 | $52,520 | $60,470 |
| 2015 | $2,046 | $96,280 | $43,770 | $52,510 |
| 2014 | $2,046 | $86,230 | $43,770 | $42,460 |
Property History
| Date | Event | Price | List to Sale | Price per Sq Ft |
|---|---|---|---|---|
| 12/07/2025 12/07/25 | For Sale | $399,000 | -- | -- |
Purchase History
| Date | Type | Sale Price | Title Company |
|---|---|---|---|
| Vendors Lien | -- | Common Wealth Title |
Mortgage History
| Date | Status | Loan Amount | Loan Type |
|---|---|---|---|
| Open | $138,000 | Purchase Money Mortgage |
Source: Houston Association of REALTORS®
MLS Number: 25865565
APN: 0281-0038-002
Disclaimer: Certain information contained herein is derived from information provided by parties other than Homes.com. All information provided is deemed reliable, but is not guaranteed to be accurate and should be independently verified.
![]() Copyright 2025, Houston REALTORS® Information Service, Inc.
Copyright 2025, Houston REALTORS® Information Service, Inc.
The information provided is exclusively for consumers’ personal, non-commercial use, and may not be used for any purpose other than to identify prospective properties consumers may be interested in purchasing.
Information is deemed reliable but not guaranteed.
- 0 County Road 48
- 7933 Iowa Colony Blvd
- 8222 Hush Heights Dr
- 8102 Buck Ln
- 1627 Yuba Valley Dr
- 0 County Road 383
- 2107 Tioga View Dr
- 1230 Mariquita Ln
- 7106 Escondido Dr
- 1310 Torrance Ln
- 6814 Ventura Dr
- 1214 Mira Mar Ct
- 2831 Obsidian Dr
- 00 County 48
- 11715 County Road 48
- 7735 Evening Emerald Dr
- 7736 Evening Emerald Dr
- 7803 Evening Emerald Dr
- 7720 Evening Emerald Dr
- 7724 Evening Emerald Dr
- 8222 Hush Heights Dr
- 10610 Crescent Peak Ct
- 10627 Great Basin Dr
- 10626 Watershed Dr
- 10519 Moon Valley Ln
- 1522 Truckee River Dr
- 1214 Mira Mar Ct
- 3118 Trail Loop S
- 2623 American Ruby Dr
- 2423 Imperial Jade Dr
- 3702 Cedar Rapids Pkwy
- 206 John House Ln
- 8914 Ice Quartz Dr
- 7730 Lavender Jade Dr
- 2403 Jasper Breeze Dr
- 9730 Kilkenny St
- 3415 Zuse St
- 2530 Green Jasper Dr
- 3418 Zuse St
- 9015 Puritan Way
