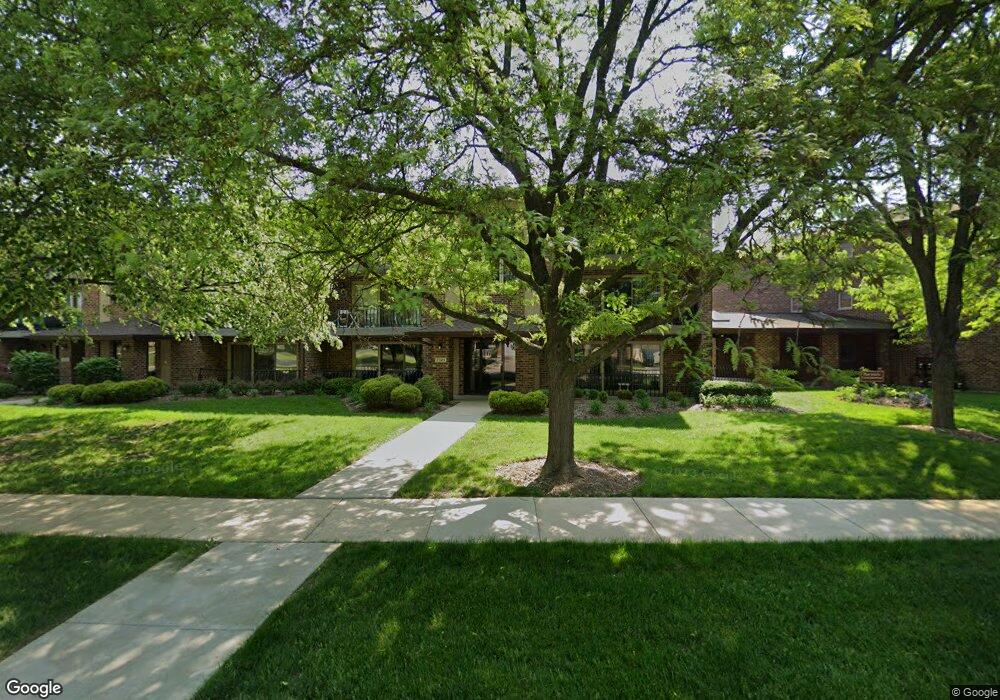
7525 Sheridan Dr Unit 11E Willowbrook, IL 60527
Estimated Value: $231,000 - $254,000
2
Beds
1
Bath
979
Sq Ft
$247/Sq Ft
Est. Value
About This Home
This home is located at 7525 Sheridan Dr Unit 11E, Willowbrook, IL 60527 and is currently estimated at $242,217, approximately $247 per square foot. 7525 Sheridan Dr Unit 11E is a home located in DuPage County with nearby schools including Gower West Elementary School, Gower Middle School, and Hinsdale South High School.
Ownership History
Date
Name
Owned For
Owner Type
Purchase Details
Closed on
May 22, 2025
Sold by
Gloria A Russo Family Trust and Russo James A
Bought by
Russo James A and Russo Joni L
Current Estimated Value
Purchase Details
Closed on
Mar 5, 2015
Sold by
Russo Gloria A
Bought by
Russo James A and Gloria A Russo Family Trust
Purchase Details
Closed on
Aug 29, 2003
Sold by
Lull David
Bought by
Russo Gloria A
Home Financials for this Owner
Home Financials are based on the most recent Mortgage that was taken out on this home.
Original Mortgage
$103,200
Interest Rate
6.33%
Mortgage Type
Stand Alone First
Purchase Details
Closed on
Jul 19, 1999
Sold by
Lull Sarah Inez
Bought by
Lull Sarah Inez and Sarah Inez Lull Trust
Purchase Details
Closed on
Jun 24, 1994
Sold by
Wojcik Stanley and Wojcik Celia
Bought by
Lull Inez S
Purchase Details
Closed on
Mar 1, 1994
Sold by
Vanson Evelyn M
Bought by
Wojcik Stanley and Wojcik Celia
Create a Home Valuation Report for This Property
The Home Valuation Report is an in-depth analysis detailing your home's value as well as a comparison with similar homes in the area
Home Values in the Area
Average Home Value in this Area
Purchase History
| Date | Buyer | Sale Price | Title Company |
|---|---|---|---|
| Russo James A | -- | None Listed On Document | |
| Russo James A | -- | None Available | |
| Russo Gloria A | $153,500 | Pntn | |
| Lull Sarah Inez | -- | -- | |
| Lull Inez S | $122,000 | -- | |
| Wojcik Stanley | $113,500 | -- |
Source: Public Records
Mortgage History
| Date | Status | Borrower | Loan Amount |
|---|---|---|---|
| Previous Owner | Russo Gloria A | $103,200 |
Source: Public Records
Tax History Compared to Growth
Tax History
| Year | Tax Paid | Tax Assessment Tax Assessment Total Assessment is a certain percentage of the fair market value that is determined by local assessors to be the total taxable value of land and additions on the property. | Land | Improvement |
|---|---|---|---|---|
| 2024 | $836 | $57,762 | $11,574 | $46,188 |
| 2023 | $875 | $53,100 | $10,640 | $42,460 |
| 2022 | $1,105 | $46,120 | $9,240 | $36,880 |
| 2021 | $1,075 | $45,590 | $9,130 | $36,460 |
| 2020 | $1,083 | $44,690 | $8,950 | $35,740 |
| 2019 | $1,089 | $42,880 | $8,590 | $34,290 |
| 2018 | $1,050 | $41,230 | $8,260 | $32,970 |
| 2017 | $1,084 | $39,680 | $7,950 | $31,730 |
| 2016 | $1,110 | $37,870 | $7,590 | $30,280 |
| 2015 | $1,167 | $35,630 | $7,140 | $28,490 |
| 2014 | $1,187 | $33,630 | $6,740 | $26,890 |
| 2013 | $1,162 | $33,470 | $6,710 | $26,760 |
Source: Public Records
Map
Nearby Homes
- 320 Sheridan Dr Unit 2C
- 7510 Farmingdale Dr Unit 208
- 7715 Sussex Creek Dr Unit 1D
- 7525 Nantucket Dr Unit 210
- 7515 Nantucket Dr Unit 404
- 716 Somerset Ln
- 7817 Mayfair Ln
- 709 79th St Unit 103
- 709 79th St Unit 403
- 801 79th St Unit 310
- 7976 Clarendon Hills Rd
- 7718 Virginia Ct
- 7715 Virginia Ct
- Lot 1, 2, 3, 4 & 5 Nantucket Dr
- 7713 Brookhaven Ave
- 7310 Capitol Dr
- 9S115 Nantucket Dr
- 9S080 Stratford Place
- 16W540 Lake Dr Unit 9-104
- 1125 Timber Ln Unit 2
- 7505 Sheridan Dr Unit 1-1B
- 7555 Sheridan Dr Unit 1E
- 7515 Sheridan Dr Unit 3D
- 7535 Sheridan Dr Unit 2B
- 7535 Sheridan Dr Unit 1B
- 7555 Sheridan Dr Unit 22F
- 7545 Sheridan Dr Unit D
- 7505 Sheridan Dr Unit 3A
- 7555 Sheridan Dr Unit 3F
- 7515 Sheridan Dr
- 7525 Sheridan Dr Unit 12F
- 7535 Sheridan Dr Unit 22A
- 7535 Sheridan Dr Unit 3B
- 7555 Sheridan Dr Unit 22E
- 7545 Sheridan Dr Unit 21D
- 7515 Sheridan Dr Unit 11C
- 7515 Sheridan Dr Unit 12C
- 7545 Sheridan Dr Unit 23C
- 7555 Sheridan Dr Unit 23E