
Seller's Agent in 2012
Tony Narcisse
HomeSmart
(678) 778-7377
31 Total Sales
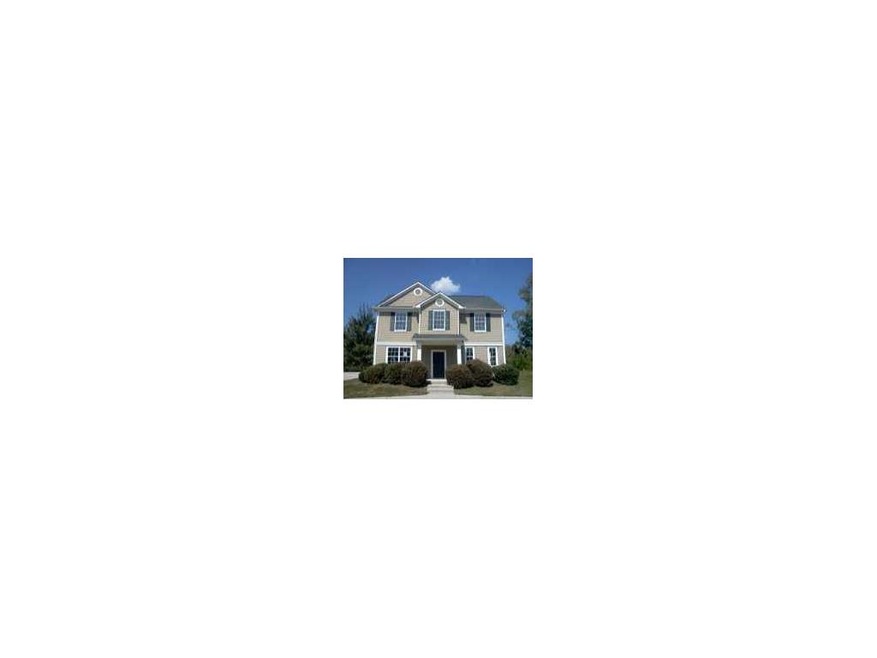
Estimated Value: $271,966 - $313,000
HUD HOME SOLD AS IS. TO SHOW USE SUPRA LOCKBOX. INFO DEEMED RELIABLE BUT NOT GUARANTEED. SELLING BROKER TO VERIFY ALL INFORMATION.
Last Buyer's Agent
Patricia Sopp
NOT A VALID MEMBER License #52778
| Date | Buyer | Sale Price | Title Company |
|---|---|---|---|
| Fayette Lamp Post Llc | -- | -- | |
| Maceno Nyka | $145,000 | -- | |
| Degrazio Barry | $161,000 | -- |
| Date | Status | Borrower | Loan Amount |
|---|---|---|---|
| Previous Owner | Maceno Nyka | $142,759 | |
| Previous Owner | Degrazio Barry | $128,800 |
| Date | Event | Price | List to Sale | Price per Sq Ft |
|---|---|---|---|---|
| 02/14/2012 02/14/12 | Sold | $51,000 | -7.3% | $30 / Sq Ft |
| 01/20/2012 01/20/12 | Pending | -- | -- | -- |
| 10/05/2011 10/05/11 | For Sale | $55,000 | -- | $32 / Sq Ft |
| Year | Tax Paid | Tax Assessment Tax Assessment Total Assessment is a certain percentage of the fair market value that is determined by local assessors to be the total taxable value of land and additions on the property. | Land | Improvement |
|---|---|---|---|---|
| 2025 | $4,550 | $104,200 | $25,120 | $79,080 |
| 2023 | $3,174 | $112,440 | $30,160 | $82,280 |
| 2022 | $3,206 | $81,760 | $15,920 | $65,840 |
| 2021 | $2,607 | $65,120 | $14,080 | $51,040 |
| 2020 | $2,619 | $64,360 | $13,920 | $50,440 |
| 2019 | $2,363 | $59,840 | $14,480 | $45,360 |
| 2018 | $2,207 | $55,440 | $13,760 | $41,680 |
| 2017 | $2,264 | $55,560 | $20,360 | $35,200 |
| 2016 | $2,265 | $55,560 | $20,360 | $35,200 |
| 2015 | $2,271 | $55,560 | $20,360 | $35,200 |
| 2014 | $1,859 | $43,120 | $9,040 | $34,080 |
Seller's Agent in 2012
Tony Narcisse
HomeSmart
(678) 778-7377
31 Total Sales
Seller Co-Listing Agent in 2012
Michelle Johnson
HomeSmart
(404) 566-0249
20 Total Sales
P
Buyer's Agent in 2012
Patricia Sopp
NOT A VALID MEMBER
Source: First Multiple Listing Service (FMLS)
MLS Number: 4281351
APN: 07-1500-0117-181-6
![]() Listings identified with the FMLS IDX logo come from FMLS and are held by brokerage firms other than the owner of this website. The listing brokerage is identified in any listing details. Information is deemed reliable but is not guaranteed. If you believe any FMLS listing contains material that infringes your copyrighted work please visit www.fmls.com/dmca to review our DMCA policy and learn how to submit a takedown request. © 2026 First Multiple Listing Service, Inc.
Listings identified with the FMLS IDX logo come from FMLS and are held by brokerage firms other than the owner of this website. The listing brokerage is identified in any listing details. Information is deemed reliable but is not guaranteed. If you believe any FMLS listing contains material that infringes your copyrighted work please visit www.fmls.com/dmca to review our DMCA policy and learn how to submit a takedown request. © 2026 First Multiple Listing Service, Inc.
Disclaimer: Certain information contained herein is derived from information provided by parties other than Homes.com. All information provided is deemed reliable, but is not guaranteed to be accurate and should be independently verified.
Ask me questions while you tour the home.