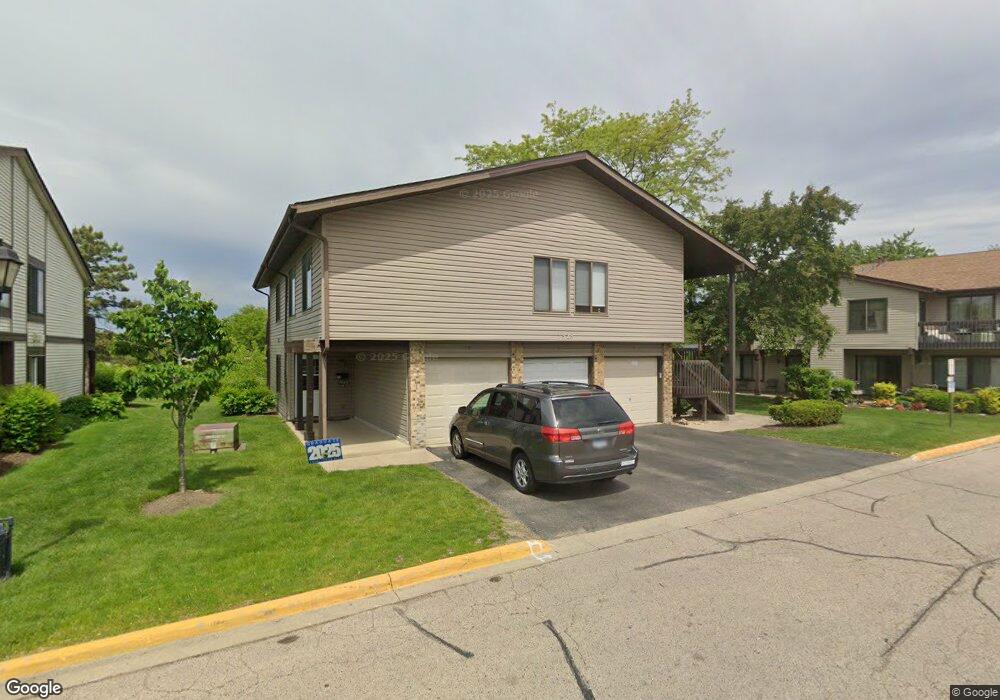
7528 Bristol Ln Unit 484 Hanover Park, IL 60133
Estimated Value: $204,000 - $224,786
2
Beds
--
Bath
1,100
Sq Ft
$197/Sq Ft
Est. Value
About This Home
This home is located at 7528 Bristol Ln Unit 484, Hanover Park, IL 60133 and is currently estimated at $216,697, approximately $196 per square foot. 7528 Bristol Ln Unit 484 is a home located in Cook County with nearby schools including Albert Einstein Elementary School, Jane Addams Junior High School, and Hoffman Estates High School.
Ownership History
Date
Name
Owned For
Owner Type
Purchase Details
Closed on
May 23, 2025
Sold by
Pawilcz Wiaczeslaw
Bought by
Shah Siddharth and Solanki Namrata
Current Estimated Value
Home Financials for this Owner
Home Financials are based on the most recent Mortgage that was taken out on this home.
Original Mortgage
$159,750
Outstanding Balance
$159,209
Interest Rate
6.88%
Mortgage Type
New Conventional
Estimated Equity
$57,488
Purchase Details
Closed on
Jul 2, 2019
Sold by
Leys Rodger L and Rodger L Leys Trust
Bought by
Pawilez Wiaczeslaw
Home Financials for this Owner
Home Financials are based on the most recent Mortgage that was taken out on this home.
Original Mortgage
$96,000
Interest Rate
4%
Mortgage Type
New Conventional
Purchase Details
Closed on
Mar 19, 1998
Sold by
Cole Taylor Bank
Bought by
Leys Rodger L and The Rodger L Leys Trust
Create a Home Valuation Report for This Property
The Home Valuation Report is an in-depth analysis detailing your home's value as well as a comparison with similar homes in the area
Home Values in the Area
Average Home Value in this Area
Purchase History
| Date | Buyer | Sale Price | Title Company |
|---|---|---|---|
| Shah Siddharth | $213,000 | None Listed On Document | |
| Pawilez Wiaczeslaw | $120,000 | Ata Gmt Title Agency | |
| Leys Rodger L | -- | -- |
Source: Public Records
Mortgage History
| Date | Status | Borrower | Loan Amount |
|---|---|---|---|
| Open | Shah Siddharth | $159,750 | |
| Previous Owner | Pawilez Wiaczeslaw | $96,000 |
Source: Public Records
Tax History Compared to Growth
Tax History
| Year | Tax Paid | Tax Assessment Tax Assessment Total Assessment is a certain percentage of the fair market value that is determined by local assessors to be the total taxable value of land and additions on the property. | Land | Improvement |
|---|---|---|---|---|
| 2024 | $4,223 | $13,380 | $537 | $12,843 |
| 2023 | $4,085 | $13,380 | $537 | $12,843 |
| 2022 | $4,085 | $13,380 | $537 | $12,843 |
| 2021 | $2,844 | $8,043 | $350 | $7,693 |
| 2020 | $2,809 | $8,043 | $350 | $7,693 |
| 2019 | $2,827 | $9,007 | $350 | $8,657 |
| 2018 | $2,650 | $7,476 | $309 | $7,167 |
| 2017 | $2,607 | $7,476 | $309 | $7,167 |
| 2016 | $2,452 | $7,476 | $309 | $7,167 |
| 2015 | $2,138 | $6,025 | $268 | $5,757 |
| 2014 | $2,097 | $6,025 | $268 | $5,757 |
| 2013 | $2,035 | $6,025 | $268 | $5,757 |
Source: Public Records
Map
Nearby Homes
- 7526 Bristol Ln Unit 502
- 7523 Bristol Ln Unit A
- 1323 Kingsbury Dr Unit 2
- 1316 Kingsbury Dr Unit 1
- 1283 Bristol Ln
- 1307 Kingsbury Dr Unit A
- 7837 Huntington Cir S
- 7873 Asbury Cir S
- 7843 Kensington Ln
- 1648 Linden Ave
- 7211 Jonquil Terrace
- 1105 Stratford Ln
- 1712 Poplar Ave
- 8138 N Carrolton Ct
- 7418 Nantucket Cove
- 7138 Edgebrook Ln
- 802 Lexington Cir
- 763 Verandah Dr
- 1591 Hillcrest Ave
- 7170 East Ave
- 7528 Bristol Ln Unit 486
- 7528 Bristol Ln Unit 485
- 7527 Bristol Ln Unit 491
- 7527 Bristol Ln Unit 492
- 7527 Bristol Ln Unit 493
- 1331 Kingsbury Dr Unit 392
- 1331 Kingsbury Dr Unit 391
- 1331 Kingsbury Dr Unit 393
- 1331 Kingsbury Dr Unit 1
- 7529 Bristol Ln Unit 462
- 7529 Bristol Ln Unit 461
- 7529 Bristol Ln Unit 463
- 7529 Bristol Ln Unit 3
- 7530 Bristol Ln Unit 475
- 7530 Bristol Ln Unit 476
- 7530 Bristol Ln Unit 474
- 7530 Bristol Ln Unit 6
- 1332 Kingsbury Dr Unit 3
- 1332 Kingsbury Dr Unit 402
- 1332 Kingsbury Dr Unit 403