Estimated Value: $508,000 - $670,032
3
Beds
4
Baths
2,024
Sq Ft
$291/Sq Ft
Est. Value
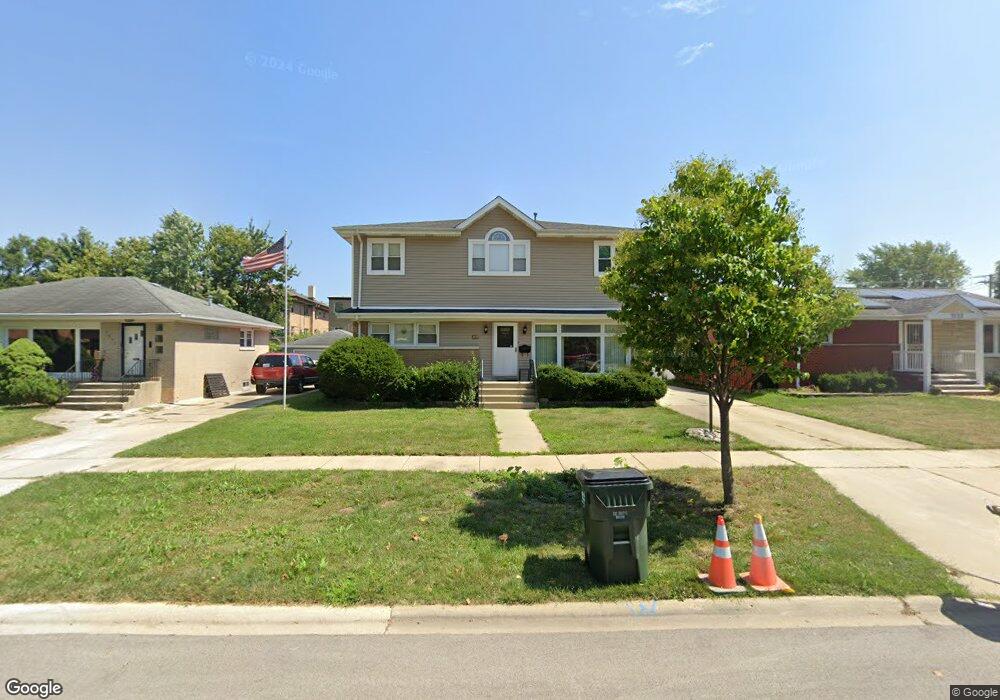
About This Home
This home is located at 7529 N Neva Ave, Niles, IL 60714 and is currently estimated at $589,008, approximately $291 per square foot. 7529 N Neva Ave is a home located in Cook County with nearby schools including Clarence E Culver School, Niles West High School, and St. Juliana School.
Ownership History
Date
Name
Owned For
Owner Type
Purchase Details
Closed on
Oct 30, 1996
Sold by
Kowalski Tadeusz and Kowalski Regina
Bought by
Pusateri Russell J and Pusateri Stacy A
Current Estimated Value
Home Financials for this Owner
Home Financials are based on the most recent Mortgage that was taken out on this home.
Original Mortgage
$163,000
Outstanding Balance
$16,263
Interest Rate
8.23%
Estimated Equity
$572,745
Purchase Details
Closed on
Dec 11, 1995
Sold by
Gunderson Shirley L
Bought by
Kowalski Tadeusz and Kowalski Regina
Home Financials for this Owner
Home Financials are based on the most recent Mortgage that was taken out on this home.
Original Mortgage
$161,500
Interest Rate
6.25%
Create a Home Valuation Report for This Property
The Home Valuation Report is an in-depth analysis detailing your home's value as well as a comparison with similar homes in the area
Home Values in the Area
Average Home Value in this Area
Purchase History
| Date | Buyer | Sale Price | Title Company |
|---|---|---|---|
| Pusateri Russell J | $275,000 | Attorneys Natl Title Network | |
| Kowalski Tadeusz | $170,000 | Attorneys Natl Title Network |
Source: Public Records
Mortgage History
| Date | Status | Borrower | Loan Amount |
|---|---|---|---|
| Open | Pusateri Russell J | $163,000 | |
| Previous Owner | Kowalski Tadeusz | $161,500 |
Source: Public Records
Tax History Compared to Growth
Tax History
| Year | Tax Paid | Tax Assessment Tax Assessment Total Assessment is a certain percentage of the fair market value that is determined by local assessors to be the total taxable value of land and additions on the property. | Land | Improvement |
|---|---|---|---|---|
| 2024 | $11,310 | $48,498 | $11,235 | $37,263 |
| 2023 | $10,580 | $52,000 | $11,235 | $40,765 |
| 2022 | $10,580 | $52,000 | $11,235 | $40,765 |
| 2021 | $9,228 | $40,569 | $7,129 | $33,440 |
| 2020 | $8,798 | $40,569 | $7,129 | $33,440 |
| 2019 | $8,805 | $45,077 | $7,129 | $37,948 |
| 2018 | $8,624 | $40,403 | $6,265 | $34,138 |
| 2017 | $8,837 | $40,403 | $6,265 | $34,138 |
| 2016 | $8,539 | $40,403 | $6,265 | $34,138 |
| 2015 | $7,577 | $34,213 | $5,401 | $28,812 |
| 2014 | $7,351 | $34,213 | $5,401 | $28,812 |
| 2013 | $7,225 | $34,213 | $5,401 | $28,812 |
Source: Public Records
Map
Nearby Homes
- 7450 N Waukegan Rd Unit 206
- 7450 N Waukegan Rd Unit 404
- 7450 N Waukegan Rd Unit 509
- 7645 N Nora Ave
- 6947 W Jarvis Ave
- 6920 W Jarvis Ave
- 7433 N Octavia Ave
- 7421 N Oketo Ave
- 6980 W Touhy Ave Unit 202
- 7753 N Nordica Ave
- 7357 N Oketo Ave
- 7091 W Touhy Ave Unit 505
- 7021 W Touhy Ave Unit 405B
- 7939 N Neva Ave
- 7305 N Oketo Ave
- 7011 W Touhy Ave Unit 506A
- 7120 N Milwaukee Ave Unit 702
- 7071 W Touhy Ave Unit 406
- 7061 W Touhy Ave Unit 307
- 7061 W Touhy Ave Unit 502
- 7523 N Neva Ave
- 7519 N Neva Ave
- 7543 N Neva Ave
- 7538 N Waukegan Rd Unit 2-E
- 7538 N Waukegan Rd Unit 2-W
- 7538 N Waukegan Rd Unit GE
- 7538 N Waukegan Rd Unit 1E
- 7538 N Waukegan Rd Unit 1-W
- 7522 N Waukegan Rd
- 7513 N Neva Ave
- 7549 N Neva Ave
- 7518 N Waukegan Rd
- 7528 N Neva Ave
- 7554 N Waukegan Rd
- 7536 N Neva Ave
- 7522 N Neva Ave
- 7512 N Waukegan Rd
- 7518 N Neva Ave
- 7542 N Neva Ave
- 7555 N Neva Ave