7529 Salt Grass Ct Colorado Springs, CO 80915
Estimated Value: $470,438 - $525,000
4
Beds
3
Baths
2,252
Sq Ft
$221/Sq Ft
Est. Value
About This Home
This home is located at 7529 Salt Grass Ct, Colorado Springs, CO 80915 and is currently estimated at $497,360, approximately $220 per square foot. 7529 Salt Grass Ct is a home located in El Paso County with nearby schools including Evans International Elementary School, Horizon Middle School, and Sand Creek High School.
Ownership History
Date
Name
Owned For
Owner Type
Purchase Details
Closed on
May 24, 2021
Sold by
Duncan Melissa L and Mitchell Melissa L
Bought by
Dungan John
Current Estimated Value
Home Financials for this Owner
Home Financials are based on the most recent Mortgage that was taken out on this home.
Original Mortgage
$241,066
Outstanding Balance
$218,124
Interest Rate
3%
Mortgage Type
FHA
Estimated Equity
$279,236
Purchase Details
Closed on
Sep 29, 2015
Sold by
Birung Romeo Z
Bought by
Dungan John and Dungan Melissa L
Home Financials for this Owner
Home Financials are based on the most recent Mortgage that was taken out on this home.
Original Mortgage
$255,290
Interest Rate
4.12%
Mortgage Type
FHA
Purchase Details
Closed on
Feb 8, 2010
Sold by
Oakwood Homes Llc
Bought by
Birung Romeo Z
Home Financials for this Owner
Home Financials are based on the most recent Mortgage that was taken out on this home.
Original Mortgage
$242,016
Interest Rate
5.5%
Mortgage Type
FHA
Create a Home Valuation Report for This Property
The Home Valuation Report is an in-depth analysis detailing your home's value as well as a comparison with similar homes in the area
Home Values in the Area
Average Home Value in this Area
Purchase History
| Date | Buyer | Sale Price | Title Company |
|---|---|---|---|
| Dungan John | -- | Land Title Guarantee Company | |
| Dungan John | $260,000 | Heritage Title | |
| Birung Romeo Z | $264,200 | Stewart Title |
Source: Public Records
Mortgage History
| Date | Status | Borrower | Loan Amount |
|---|---|---|---|
| Open | Dungan John | $241,066 | |
| Previous Owner | Dungan John | $255,290 | |
| Previous Owner | Birung Romeo Z | $242,016 |
Source: Public Records
Tax History Compared to Growth
Tax History
| Year | Tax Paid | Tax Assessment Tax Assessment Total Assessment is a certain percentage of the fair market value that is determined by local assessors to be the total taxable value of land and additions on the property. | Land | Improvement |
|---|---|---|---|---|
| 2025 | $2,777 | $33,430 | -- | -- |
| 2024 | $2,672 | $33,310 | $6,880 | $26,430 |
| 2023 | $2,672 | $33,310 | $6,880 | $26,430 |
| 2022 | $2,234 | $23,220 | $5,420 | $17,800 |
| 2021 | $2,318 | $23,890 | $5,580 | $18,310 |
| 2020 | $2,071 | $21,290 | $4,650 | $16,640 |
| 2019 | $2,058 | $21,290 | $4,650 | $16,640 |
| 2018 | $1,915 | $19,610 | $3,920 | $15,690 |
| 2017 | $1,798 | $19,610 | $3,920 | $15,690 |
| 2016 | $1,690 | $18,800 | $3,940 | $14,860 |
| 2015 | $1,691 | $18,800 | $3,940 | $14,860 |
| 2014 | $1,646 | $18,050 | $4,300 | $13,750 |
Source: Public Records
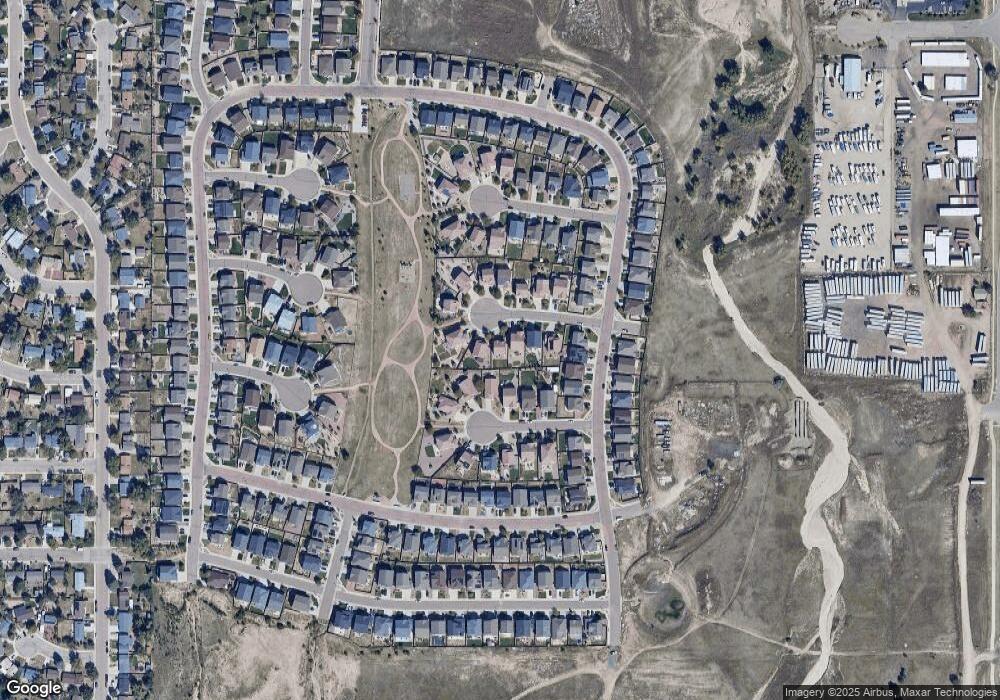
Map
Nearby Homes
- 1985 Reed Grass Way
- 7340 Grama Grass Ct
- 2215 Reed Grass Way
- 2245 Reed Grass Way
- 1822 Bulrush Way
- 2255 Green Grass Ct
- 2421 Fruited Plains Ct
- 2034 Lillian Way
- 7225 Palmer Park Blvd
- 1725 Bucolo Ave
- 1695 Bucolo Ave
- 1945 Mineola St
- 2453 Vanhoutte View
- 2429 Vanhoutte View
- 7515 Fountain Grass Grove
- 2435 Vanhoutte View
- 1874 Sandtoft Heights
- 1729 Sandtoft Heights
- 1850 Sandtoft Heights
- 1873 Sandtoft Heights
- 7541 Salt Grass Ct
- 7517 Salt Grass Ct
- 7565 Salt Grass Ct
- 7528 Short Grass Ct
- 7540 Short Grass Ct
- 7505 Salt Grass Ct
- 7516 Short Grass Ct
- 7577 Salt Grass Ct
- 7552 Short Grass Ct
- 7542 Salt Grass Ct
- 7506 Salt Grass Ct
- 7554 Salt Grass Ct
- 7564 Short Grass Ct
- 7566 Salt Grass Ct
- 7530 Salt Grass Ct
- 7504 Short Grass Ct
- 1984 Reed Grass Way
- 1964 Reed Grass Way
- 7518 Salt Grass Ct
- 1954 Reed Grass Way