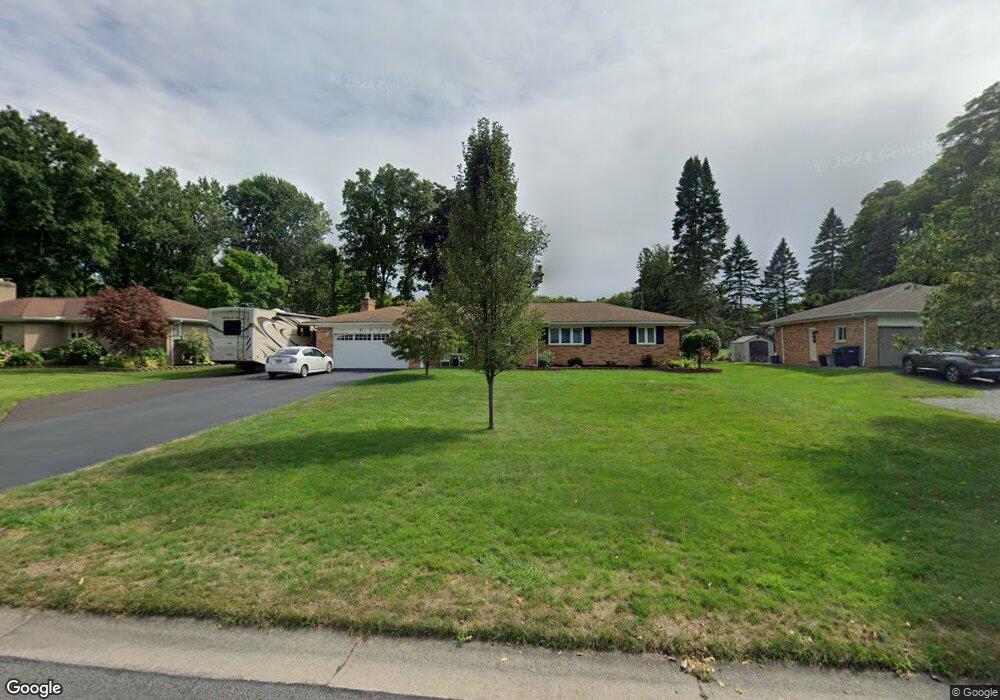
753 John Glenn Blvd Webster, NY 14580
Estimated Value: $303,000 - $384,000
3
Beds
2
Baths
1,602
Sq Ft
$218/Sq Ft
Est. Value
About This Home
This home is located at 753 John Glenn Blvd, Webster, NY 14580 and is currently estimated at $348,773, approximately $217 per square foot. 753 John Glenn Blvd is a home located in Monroe County with nearby schools including Klem Road South Elementary School, Willink Middle School, and Thomas High School.
Ownership History
Date
Name
Owned For
Owner Type
Purchase Details
Closed on
Feb 3, 2017
Sold by
Stony Point Real Estate Group
Bought by
Mcalpin Daniel and Mcalpin Jackie
Current Estimated Value
Home Financials for this Owner
Home Financials are based on the most recent Mortgage that was taken out on this home.
Original Mortgage
$140,000
Outstanding Balance
$115,882
Interest Rate
4.19%
Estimated Equity
$232,891
Purchase Details
Closed on
Oct 4, 2016
Sold by
Keybank National Association and Adams Julie A
Bought by
Stony Point Real Estate Group Llc
Purchase Details
Closed on
Nov 7, 2011
Sold by
Adams Julie A
Bought by
Adams Philip
Purchase Details
Closed on
Feb 22, 2011
Sold by
Adams Philip J
Bought by
Adams Julie A
Purchase Details
Closed on
Apr 28, 2009
Sold by
Adams Philip
Bought by
Adams Julie A and Adams Philip J
Purchase Details
Closed on
Jun 28, 1996
Create a Home Valuation Report for This Property
The Home Valuation Report is an in-depth analysis detailing your home's value as well as a comparison with similar homes in the area
Home Values in the Area
Average Home Value in this Area
Purchase History
| Date | Buyer | Sale Price | Title Company |
|---|---|---|---|
| Mcalpin Daniel | -- | -- | |
| Stony Point Real Estate Group Llc | $116,500 | Web Title Agency | |
| Adams Philip | -- | None Available | |
| Adams Julie A | -- | None Available | |
| Adams Julie A | -- | None Available | |
| -- | -- | -- |
Source: Public Records
Mortgage History
| Date | Status | Borrower | Loan Amount |
|---|---|---|---|
| Open | Mcalpin Daniel | $140,000 | |
| Closed | Mcalpin Daniel | -- |
Source: Public Records
Tax History Compared to Growth
Tax History
| Year | Tax Paid | Tax Assessment Tax Assessment Total Assessment is a certain percentage of the fair market value that is determined by local assessors to be the total taxable value of land and additions on the property. | Land | Improvement |
|---|---|---|---|---|
| 2024 | $6,075 | $147,300 | $30,000 | $117,300 |
| 2023 | $6,075 | $147,300 | $30,000 | $117,300 |
| 2022 | $6,804 | $147,300 | $30,000 | $117,300 |
| 2021 | $6,742 | $147,300 | $30,000 | $117,300 |
| 2020 | $6,635 | $147,300 | $30,000 | $117,300 |
| 2019 | $6,426 | $147,300 | $30,000 | $117,300 |
| 2018 | $6,357 | $147,300 | $30,000 | $117,300 |
| 2017 | $9,866 | $147,300 | $30,000 | $117,300 |
| 2016 | $6,426 | $147,300 | $30,000 | $117,300 |
| 2015 | -- | $147,300 | $30,000 | $117,300 |
| 2014 | -- | $147,300 | $30,000 | $117,300 |
Source: Public Records
Map
Nearby Homes
- 785 John Glenn Blvd
- 711 Audley End
- 1012 Railway Crossing
- 757 Bel Arbor Trail
- 949 Timberland Ct
- 629 Bending Bough Dr
- 1127 Brooktree Ln
- 1128 Ridge Rd
- 1116 Brown Dr
- 787 Tinker Tavern Rd
- 66 E Main St
- 107 Cranbrook Terrace
- 851 Phillips Rd
- 171 Cranbrook Terrace
- 67 Winfield Ln
- 219 Rayfield Cir
- 619 Pine Lakes Trail
- 613 Pine Lakes Trail
- 143 London Rd
- 441 Thyme Dr
- 749 John Glenn Blvd
- 757 John Glenn Blvd
- 745 John Glenn Blvd
- 761 John Glenn Blvd
- 1136 Amberwood Ln
- 1140 Amberwood Ln
- 752 John Glenn Blvd
- 1132 Amberwood Ln
- 756 John Glenn Blvd
- 748 John Glenn Blvd
- 741 John Glenn Blvd
- 765 John Glenn Blvd
- 1144 Amberwood Ln
- 760 John Glenn Blvd
- 744 John Glenn Blvd
- 1148 Amberwood Ln
- 737 John Glenn Blvd
- 769 John Glenn Blvd
- 764 John Glenn Blvd
- 740 John Glenn Blvd