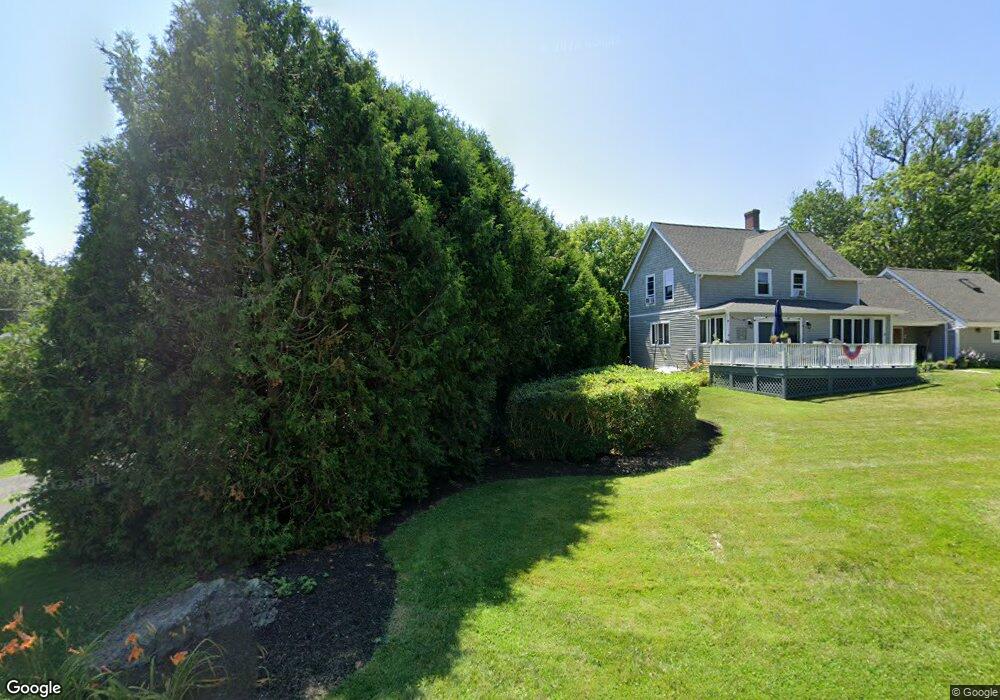
753 Pearse Rd Swansea, MA 02777
Touisset NeighborhoodEstimated Value: $394,000 - $478,000
2
Beds
1
Bath
1,053
Sq Ft
$422/Sq Ft
Est. Value
About This Home
This home is located at 753 Pearse Rd, Swansea, MA 02777 and is currently estimated at $444,733, approximately $422 per square foot. 753 Pearse Rd is a home located in Bristol County with nearby schools including Joseph Case High School, East Bay Career Academy, and Swansea Wood School.
Ownership History
Date
Name
Owned For
Owner Type
Purchase Details
Closed on
Nov 21, 2012
Sold by
Neville Christine M
Bought by
Neville Craig M and Neville Christine M
Current Estimated Value
Purchase Details
Closed on
Aug 21, 2012
Sold by
Neville Russell B and Neville Holly E
Bought by
Neville Christine M
Home Financials for this Owner
Home Financials are based on the most recent Mortgage that was taken out on this home.
Original Mortgage
$116,800
Interest Rate
3.67%
Mortgage Type
New Conventional
Purchase Details
Closed on
Aug 3, 2006
Sold by
Neville Holly E
Bought by
Neville Holly E and Neville Russell B
Create a Home Valuation Report for This Property
The Home Valuation Report is an in-depth analysis detailing your home's value as well as a comparison with similar homes in the area
Home Values in the Area
Average Home Value in this Area
Purchase History
| Date | Buyer | Sale Price | Title Company |
|---|---|---|---|
| Neville Craig M | -- | -- | |
| Neville Christine M | $146,000 | -- | |
| Neville Holly E | -- | -- |
Source: Public Records
Mortgage History
| Date | Status | Borrower | Loan Amount |
|---|---|---|---|
| Previous Owner | Neville Christine M | $116,800 |
Source: Public Records
Tax History
| Year | Tax Paid | Tax Assessment Tax Assessment Total Assessment is a certain percentage of the fair market value that is determined by local assessors to be the total taxable value of land and additions on the property. | Land | Improvement |
|---|---|---|---|---|
| 2025 | $4,768 | $400,000 | $219,000 | $181,000 |
| 2024 | $4,748 | $396,000 | $219,000 | $177,000 |
| 2023 | $4,328 | $329,600 | $166,600 | $163,000 |
| 2022 | $3,904 | $271,300 | $129,300 | $142,000 |
| 2021 | $3,920 | $250,800 | $137,100 | $113,700 |
| 2020 | $3,890 | $249,700 | $137,100 | $112,600 |
| 2019 | $3,608 | $232,600 | $122,500 | $110,100 |
| 2018 | $3,643 | $238,400 | $128,300 | $110,100 |
| 2017 | $3,361 | $253,100 | $138,100 | $115,000 |
| 2016 | $3,281 | $242,700 | $137,000 | $105,700 |
| 2015 | $3,095 | $235,700 | $137,000 | $98,700 |
| 2014 | $2,994 | $233,200 | $137,000 | $96,200 |
Source: Public Records
Map
Nearby Homes
- 15 Seaview Ave
- 9 Windward Way
- 95 Winslow Way
- 110 Seaview Ave
- 502 Ocean Grove Ave
- 25 Inverness Rd
- 45 Obannon Place
- 86 Ocean View Ave
- 72 Ocean View Ave
- 0 Barton Ave
- 105 Birchwood Dr
- 87 Shore Ave
- 795 Old Warren Rd
- 98 Cliff Ave
- 586 Child St
- 179 Schoolhouse Rd
- 162 Wilbur Ave
- 33 Detroit Ave
- 36 Kinnicutt Ave
- 1366 Gardners Neck Rd
Your Personal Tour Guide
Ask me questions while you tour the home.