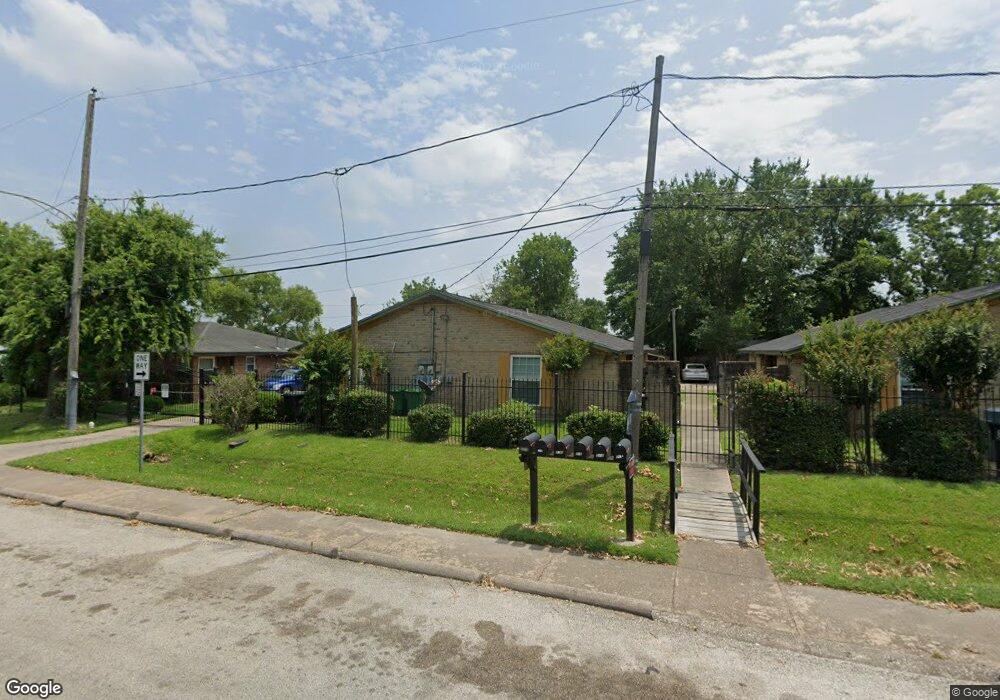
753 Ringold St Houston, TX 77088
Acres Homes NeighborhoodEstimated Value: $213,000 - $461,000
4
Beds
2
Baths
2,156
Sq Ft
$137/Sq Ft
Est. Value
About This Home
This home is located at 753 Ringold St, Houston, TX 77088 and is currently estimated at $296,261, approximately $137 per square foot. 753 Ringold St is a home located in Harris County with nearby schools including Osborne Elementary School, Williams Middle, and Booker T Washington Sr High.
Ownership History
Date
Name
Owned For
Owner Type
Purchase Details
Closed on
Mar 12, 2015
Sold by
Vela Pedro
Bought by
Gordoniz Azul Investment Corp
Current Estimated Value
Home Financials for this Owner
Home Financials are based on the most recent Mortgage that was taken out on this home.
Original Mortgage
$59,500
Outstanding Balance
$33,687
Interest Rate
3.68%
Mortgage Type
New Conventional
Estimated Equity
$262,574
Create a Home Valuation Report for This Property
The Home Valuation Report is an in-depth analysis detailing your home's value as well as a comparison with similar homes in the area
Home Values in the Area
Average Home Value in this Area
Purchase History
| Date | Buyer | Sale Price | Title Company |
|---|---|---|---|
| Gordoniz Azul Investment Corp | -- | None Available |
Source: Public Records
Mortgage History
| Date | Status | Borrower | Loan Amount |
|---|---|---|---|
| Open | Gordoniz Azul Investment Corp | $59,500 |
Source: Public Records
Tax History Compared to Growth
Tax History
| Year | Tax Paid | Tax Assessment Tax Assessment Total Assessment is a certain percentage of the fair market value that is determined by local assessors to be the total taxable value of land and additions on the property. | Land | Improvement |
|---|---|---|---|---|
| 2025 | $3,411 | $208,563 | $73,800 | $134,763 |
| 2024 | $3,411 | $163,000 | $73,800 | $89,200 |
| 2023 | $3,411 | $163,000 | $73,800 | $89,200 |
| 2022 | $3,748 | $170,200 | $57,600 | $112,600 |
| 2021 | $3,519 | $151,000 | $37,800 | $113,200 |
| 2020 | $3,107 | $128,297 | $32,400 | $95,897 |
| 2019 | $3,037 | $120,000 | $28,800 | $91,200 |
| 2018 | $2,541 | $100,400 | $16,200 | $84,200 |
| 2017 | $2,402 | $95,000 | $10,800 | $84,200 |
| 2016 | $2,402 | $95,000 | $10,800 | $84,200 |
| 2015 | $2,350 | $91,400 | $10,800 | $80,600 |
| 2014 | $2,350 | $91,400 | $10,800 | $80,600 |
Source: Public Records
Map
Nearby Homes
- 755 Ringold St
- 751 Ringold St
- 763 Ringold St
- 754 Enterprise St
- 758 Enterprise St
- 750 Enterprise St
- 818 Enterprise
- 0 Ringold St
- 0 Enterprise St
- 768 Enterprise St
- 775 Ringold St
- 770 Enterprise St
- 755 Enterprise St
- 759 Enterprise St
- 751 Enterprise St
- 765 Enterprise St Unit E
- 765 Enterprise St Unit A
- 779 Ringold St
- 767 Enterprise St
- 776 Enterprise St