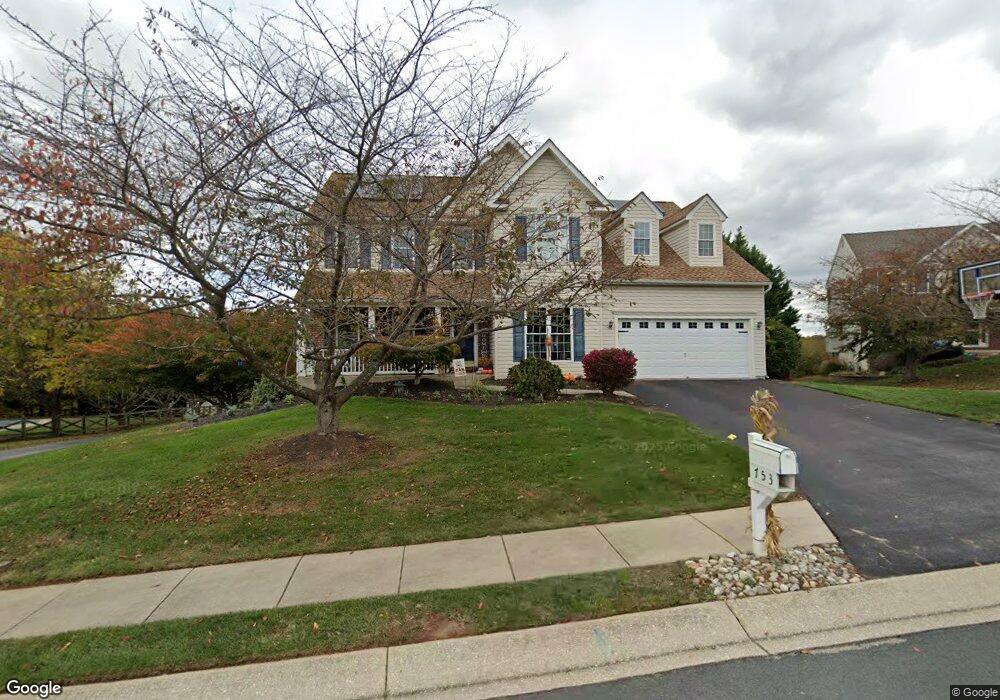
753 Sussex Ct Sykesville, MD 21784
Estimated Value: $780,000 - $829,000
--
Bed
4
Baths
3,009
Sq Ft
$265/Sq Ft
Est. Value
About This Home
This home is located at 753 Sussex Ct, Sykesville, MD 21784 and is currently estimated at $798,365, approximately $265 per square foot. 753 Sussex Ct is a home located in Carroll County with nearby schools including Eldersburg Elementary School, Sykesville Middle School, and Century High School.
Ownership History
Date
Name
Owned For
Owner Type
Purchase Details
Closed on
Nov 19, 2021
Sold by
Burrows David Andrew
Bought by
Burrows David Andrew and Burrows Karen Anne
Current Estimated Value
Home Financials for this Owner
Home Financials are based on the most recent Mortgage that was taken out on this home.
Original Mortgage
$547,415
Outstanding Balance
$502,649
Interest Rate
3.14%
Mortgage Type
FHA
Estimated Equity
$295,716
Purchase Details
Closed on
Oct 22, 2013
Sold by
Burrows David Andrew and Burrows Tammy Lynne
Bought by
Burrows David Andrew
Home Financials for this Owner
Home Financials are based on the most recent Mortgage that was taken out on this home.
Original Mortgage
$404,000
Interest Rate
4.36%
Mortgage Type
New Conventional
Purchase Details
Closed on
Mar 6, 2000
Sold by
Edgewood Homes Limited
Bought by
Burrows David Andrew and Burrows Tammy Lynne
Create a Home Valuation Report for This Property
The Home Valuation Report is an in-depth analysis detailing your home's value as well as a comparison with similar homes in the area
Home Values in the Area
Average Home Value in this Area
Purchase History
| Date | Buyer | Sale Price | Title Company |
|---|---|---|---|
| Burrows David Andrew | -- | Capitol Title Group | |
| Burrows David Andrew | -- | Real Estate Title & Escrow | |
| Burrows David Andrew | $287,563 | -- |
Source: Public Records
Mortgage History
| Date | Status | Borrower | Loan Amount |
|---|---|---|---|
| Open | Burrows David Andrew | $547,415 | |
| Closed | Burrows David Andrew | $547,415 | |
| Closed | Burrows David Andrew | $404,000 |
Source: Public Records
Tax History Compared to Growth
Tax History
| Year | Tax Paid | Tax Assessment Tax Assessment Total Assessment is a certain percentage of the fair market value that is determined by local assessors to be the total taxable value of land and additions on the property. | Land | Improvement |
|---|---|---|---|---|
| 2025 | $6,913 | $634,500 | $0 | $0 |
| 2024 | $6,913 | $595,700 | $180,000 | $415,700 |
| 2023 | $6,647 | $577,233 | $0 | $0 |
| 2022 | $6,440 | $558,767 | $0 | $0 |
| 2021 | $12,870 | $540,300 | $180,000 | $360,300 |
| 2020 | $6,107 | $525,867 | $0 | $0 |
| 2019 | $5,944 | $511,433 | $0 | $0 |
| 2018 | $5,730 | $497,000 | $160,000 | $337,000 |
| 2017 | $5,730 | $497,000 | $0 | $0 |
| 2016 | -- | $497,000 | $0 | $0 |
| 2015 | -- | $497,500 | $0 | $0 |
| 2014 | -- | $490,533 | $0 | $0 |
Source: Public Records
Map
Nearby Homes
- 610 Okemo Dr
- 5615 Bartholow Rd
- 618 Lynn Way
- 5712 Hodges Rd
- 5725 Hodges Rd
- 0 Johnsville Rd Unit MDCR2020412
- 224 Old Liberty Rd
- 42 Liberty Rd
- 42 Liberty Rd Unit D
- 1324 Cabello Ct
- HS1 Kenard Dr
- 1471 4 Point Ct
- 577 Johnsville Rd
- 6210 Rolling View Dr
- 1966 Conan Doyle Way
- 6223 E Hemlock Dr
- 5530 Jim Pickett Rd
- 5722 Banjo Dr
- 1696 Gemini Dr
- 601 Sherry Dr