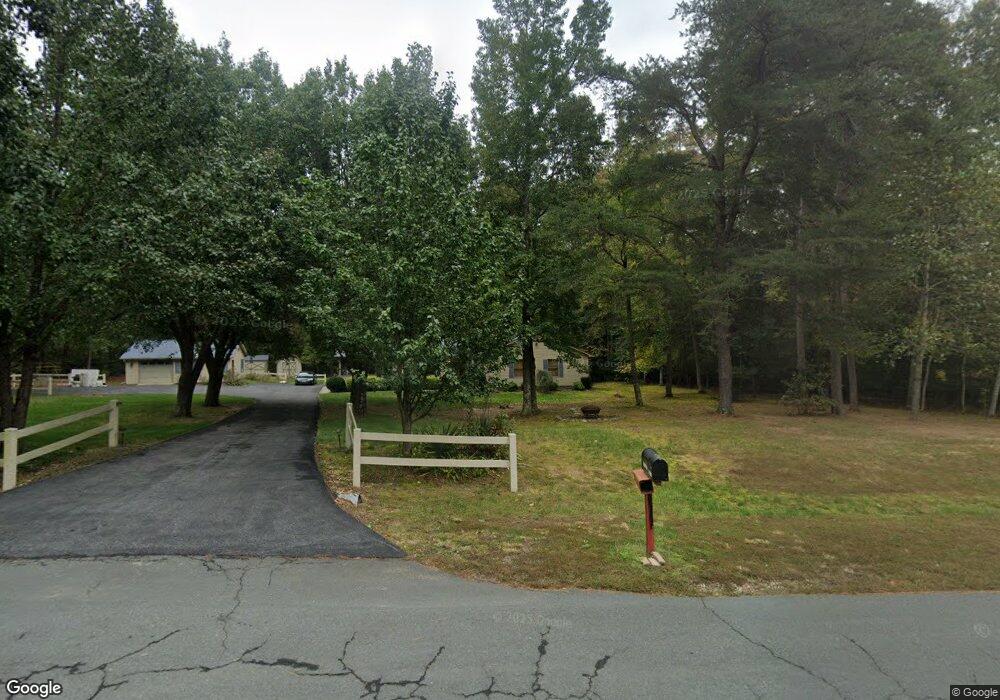
7530 Serenity Dr Hughesville, MD 20637
Estimated Value: $451,613 - $527,000
--
Bed
2
Baths
1,838
Sq Ft
$260/Sq Ft
Est. Value
About This Home
This home is located at 7530 Serenity Dr, Hughesville, MD 20637 and is currently estimated at $477,903, approximately $260 per square foot. 7530 Serenity Dr is a home located in Charles County with nearby schools including T.C. Martin Elementary School, Milton M. Somers Middle School, and La Plata High School.
Ownership History
Date
Name
Owned For
Owner Type
Purchase Details
Closed on
Mar 14, 2025
Sold by
Bilbra James Randall and Goetz Braden L
Bought by
Bilbra Rachel Marie
Current Estimated Value
Home Financials for this Owner
Home Financials are based on the most recent Mortgage that was taken out on this home.
Original Mortgage
$369,000
Interest Rate
6.65%
Mortgage Type
New Conventional
Purchase Details
Closed on
Oct 25, 2024
Sold by
Bilbra Carole F and Bilbra James Randall
Bought by
Bilbra Carole F and Bilbra James Randall
Home Financials for this Owner
Home Financials are based on the most recent Mortgage that was taken out on this home.
Original Mortgage
$320,000
Interest Rate
6.08%
Mortgage Type
New Conventional
Purchase Details
Closed on
Dec 15, 2020
Sold by
Bilbra Carole F
Bought by
Bilbra Carole F and Bilbra James Randall
Purchase Details
Closed on
Apr 5, 1983
Sold by
Maryland Quality Homes Inc
Bought by
Bilbra James D and Bilbra Carole F
Create a Home Valuation Report for This Property
The Home Valuation Report is an in-depth analysis detailing your home's value as well as a comparison with similar homes in the area
Home Values in the Area
Average Home Value in this Area
Purchase History
| Date | Buyer | Sale Price | Title Company |
|---|---|---|---|
| Bilbra Rachel Marie | $465,000 | Dulaney Title | |
| Bilbra Carole F | -- | Double Eagle Title | |
| Bilbra Carole F | -- | Double Eagle Title | |
| Bilbra Carole F | -- | Accommodation | |
| Bilbra James D | $20,000 | -- |
Source: Public Records
Mortgage History
| Date | Status | Borrower | Loan Amount |
|---|---|---|---|
| Previous Owner | Bilbra Rachel Marie | $369,000 | |
| Previous Owner | Bilbra Carole F | $320,000 |
Source: Public Records
Tax History Compared to Growth
Tax History
| Year | Tax Paid | Tax Assessment Tax Assessment Total Assessment is a certain percentage of the fair market value that is determined by local assessors to be the total taxable value of land and additions on the property. | Land | Improvement |
|---|---|---|---|---|
| 2025 | $11,513 | $374,067 | -- | -- |
| 2024 | $5,041 | $353,733 | $0 | $0 |
| 2023 | $4,764 | $333,400 | $150,200 | $183,200 |
| 2022 | $2,831 | $327,800 | $0 | $0 |
| 2021 | $6,025 | $322,200 | $0 | $0 |
| 2020 | $4,455 | $316,600 | $150,200 | $166,400 |
| 2019 | $8,497 | $307,267 | $0 | $0 |
| 2018 | $3,924 | $297,933 | $0 | $0 |
| 2017 | $3,919 | $288,600 | $0 | $0 |
| 2016 | -- | $282,400 | $0 | $0 |
| 2015 | $3,874 | $276,200 | $0 | $0 |
| 2014 | $3,874 | $270,000 | $0 | $0 |
Source: Public Records
Map
Nearby Homes
- 7490 Serenity Dr
- 0 Keech Rd Unit MDCH2037772
- 13829 Beech Hill Place
- 8070 Amberleigh Place
- 14050 Oaks Rd
- 7951 Olivers Shop Rd
- 8305 Olivers Shop Rd
- 14815 Pale Morning Place
- 12475 Helen Fowlers Place
- 6805 Pale Morning Ct
- 8525 Trinity Church Rd
- 14165 Shelwick Place
- 14150 Jaydale Place
- 7939 William Smallwood Ct
- LOT 2 Trinity Church Rd
- 7928 William Smallwood Ct
- 12214 Calverts Run Ct
- 13311 Windjammer Ct
- 13301 Windjammer Ct
- 9175 Dubois Rd
- 13555 Meadow Ct
- 13525 Ridge Place
- 7545 Serenity Dr
- 7540 Serenity Dr
- 13520 Ridge Place
- 13515 Ridge Place
- 13550 Meadow Ct
- 7515 Serenity Dr
- 13565 Meadow Ct
- 13510 Ridge Place
- 13505 Ridge Place
- 7500 Serenity Dr
- 13560 Meadow Ct
- 13500 Ridge Place
- 13555 Forest Place
- 7550 Serenity Dr
- 7555 Serenity Dr
- 13535 Forest Place
- 7590 So Busy Place
- 13525 Forest Place