Estimated Value: $276,504 - $318,000
3
Beds
1
Bath
1,040
Sq Ft
$285/Sq Ft
Est. Value
About This Home
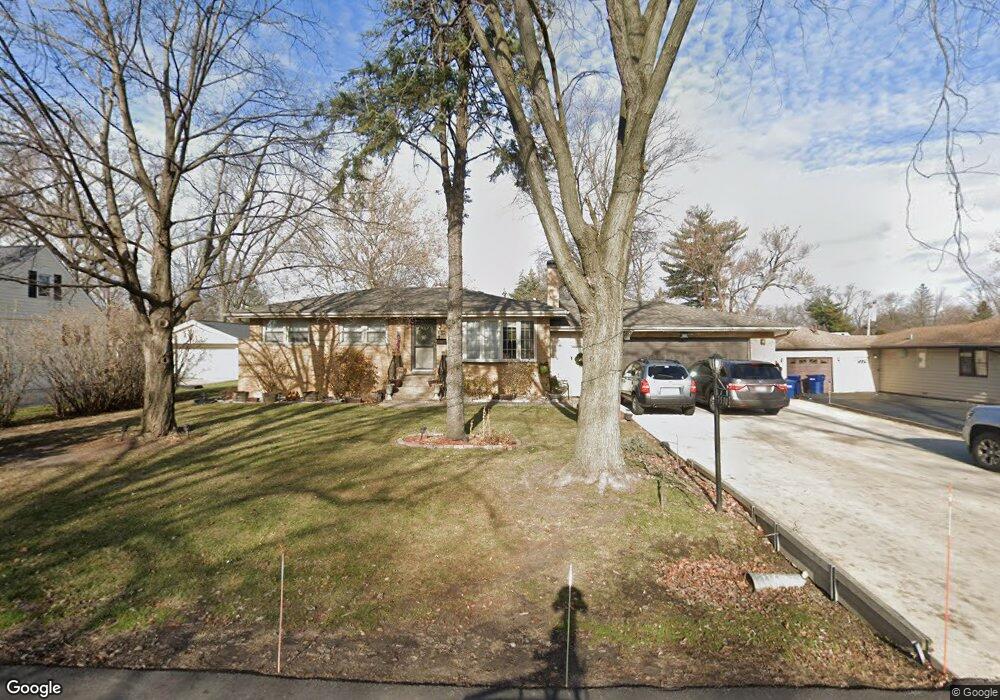
This home is located at 7530 W 109th Place, Worth, IL 60482 and is currently estimated at $296,626, approximately $285 per square foot. 7530 W 109th Place is a home located in Cook County with nearby schools including Worthwoods Elementary School, Worth Jr High School, and Amos Alonzo Stagg High School.
Ownership History
Date
Name
Owned For
Owner Type
Purchase Details
Closed on
Jun 4, 2009
Sold by
Casello Mary Jo
Bought by
Mars Peter G and Papucci Anastasia P
Current Estimated Value
Home Financials for this Owner
Home Financials are based on the most recent Mortgage that was taken out on this home.
Original Mortgage
$173,992
Outstanding Balance
$110,286
Interest Rate
4.83%
Mortgage Type
FHA
Estimated Equity
$186,340
Purchase Details
Closed on
Nov 7, 2003
Sold by
Bramlett Kimberly M and Galvin Kimberly M
Bought by
Mineiko Kurt T
Purchase Details
Closed on
Apr 23, 1998
Sold by
Schoonveld Julie and Mineiko Bruno Francis
Bought by
Bramlett Kimberly M
Home Financials for this Owner
Home Financials are based on the most recent Mortgage that was taken out on this home.
Original Mortgage
$101,250
Interest Rate
7.19%
Create a Home Valuation Report for This Property
The Home Valuation Report is an in-depth analysis detailing your home's value as well as a comparison with similar homes in the area
Home Values in the Area
Average Home Value in this Area
Purchase History
| Date | Buyer | Sale Price | Title Company |
|---|---|---|---|
| Mars Peter G | $190,000 | Pntn | |
| Mineiko Kurt T | -- | Chicago Title Insurance Comp | |
| Bramlett Kimberly M | $135,000 | Professional National Title |
Source: Public Records
Mortgage History
| Date | Status | Borrower | Loan Amount |
|---|---|---|---|
| Open | Mars Peter G | $173,992 | |
| Previous Owner | Bramlett Kimberly M | $101,250 |
Source: Public Records
Tax History Compared to Growth
Tax History
| Year | Tax Paid | Tax Assessment Tax Assessment Total Assessment is a certain percentage of the fair market value that is determined by local assessors to be the total taxable value of land and additions on the property. | Land | Improvement |
|---|---|---|---|---|
| 2024 | $6,147 | $22,180 | $10,064 | $12,116 |
| 2023 | $5,138 | $23,000 | $10,064 | $12,936 |
| 2022 | $5,138 | $16,707 | $5,661 | $11,046 |
| 2021 | $5,016 | $16,707 | $5,661 | $11,046 |
| 2020 | $4,917 | $16,707 | $5,661 | $11,046 |
| 2019 | $5,538 | $17,960 | $5,032 | $12,928 |
| 2018 | $5,636 | $17,960 | $5,032 | $12,928 |
| 2017 | $5,473 | $17,960 | $5,032 | $12,928 |
| 2016 | $5,121 | $15,031 | $4,403 | $10,628 |
| 2015 | $4,997 | $15,031 | $4,403 | $10,628 |
| 2014 | $4,930 | $15,031 | $4,403 | $10,628 |
| 2013 | $4,238 | $14,481 | $4,403 | $10,078 |
Source: Public Records
Map
Nearby Homes
- 10956 S 76th Ave Unit H
- 10832 S 76th Ave Unit 2T
- 7434 W 111th St Unit 812
- 7402 W 111th St Unit 111
- 7801 W 111th St
- 10840 S Harlem Ave
- 7201 W 110th St
- 11257 S Pacific Dr
- 7400 W 113th Place
- 7401 W 113th Place
- 7110 W 107th St Unit 16
- 10506 S Michael Dr
- 11245 S Harlem Ave Unit A12
- 11050 S Roberts Rd
- 10820 Kathleen Ct Unit D
- 10940 S Worth Ave Unit 1094011
- 8058 Circle Dr
- 11156 S Worth Ave
- 10738 S Worth Ave
- 10718 S Worth Ave
- 7514 W 109th Place
- 7528 W 109th Place
- 7523 W 109th St
- 7510 W 109th Place
- 7534 W 109th Place
- 7515 W 109th St
- 7527 W 109th St
- 7509 W 109th St
- 7533 W 109th St
- 7515 W 109th Place
- 7527 W 109th Place
- 7502 W 109th Place
- 7540 W 109th Place
- 7511 W 109th Place
- 7533 W 109th Place
- 7501 W 109th St
- 7539 W 109th St
- 7501 W 109th Place
- 7501 W 109th Place