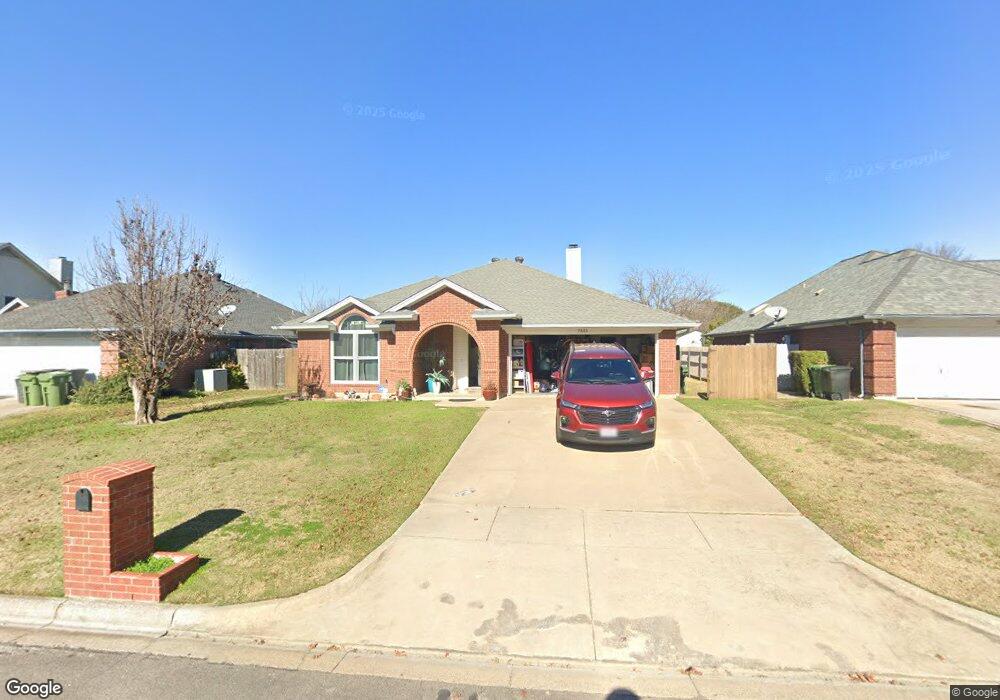
7533 Steward Ln North Richland Hills, TX 76182
Estimated Value: $325,000 - $372,000
3
Beds
2
Baths
1,611
Sq Ft
$211/Sq Ft
Est. Value
About This Home
This home is located at 7533 Steward Ln, North Richland Hills, TX 76182 and is currently estimated at $339,293, approximately $210 per square foot. 7533 Steward Ln is a home located in Tarrant County with nearby schools including Smithfield Elementary School, Smithfield Middle School, and Birdville High School.
Ownership History
Date
Name
Owned For
Owner Type
Purchase Details
Closed on
Jun 17, 2024
Sold by
Beckermann Jacqulyn Sasha and Beckermann Roger Allan
Bought by
Beckermann Roger Allan
Current Estimated Value
Purchase Details
Closed on
Nov 20, 2015
Sold by
Swabowicz Michael
Bought by
Beckermann Ii Roger and Beckermann Jacqulyn
Home Financials for this Owner
Home Financials are based on the most recent Mortgage that was taken out on this home.
Original Mortgage
$136,000
Interest Rate
3.8%
Mortgage Type
New Conventional
Purchase Details
Closed on
May 12, 1995
Sold by
Morrison Robert W and Morrison Kristen L
Bought by
Swabowicz Michael and Swabowicz Lisa J
Home Financials for this Owner
Home Financials are based on the most recent Mortgage that was taken out on this home.
Original Mortgage
$85,050
Interest Rate
8.36%
Mortgage Type
Seller Take Back
Create a Home Valuation Report for This Property
The Home Valuation Report is an in-depth analysis detailing your home's value as well as a comparison with similar homes in the area
Home Values in the Area
Average Home Value in this Area
Purchase History
| Date | Buyer | Sale Price | Title Company |
|---|---|---|---|
| Beckermann Roger Allan | -- | None Listed On Document | |
| Beckermann Ii Roger | -- | Attorney | |
| Swabowicz Michael | -- | Stewart Title |
Source: Public Records
Mortgage History
| Date | Status | Borrower | Loan Amount |
|---|---|---|---|
| Previous Owner | Beckermann Ii Roger | $136,000 | |
| Previous Owner | Swabowicz Michael | $85,050 |
Source: Public Records
Tax History Compared to Growth
Tax History
| Year | Tax Paid | Tax Assessment Tax Assessment Total Assessment is a certain percentage of the fair market value that is determined by local assessors to be the total taxable value of land and additions on the property. | Land | Improvement |
|---|---|---|---|---|
| 2025 | $5,099 | $321,570 | $60,000 | $261,570 |
| 2024 | $5,099 | $321,570 | $60,000 | $261,570 |
| 2023 | $4,690 | $341,191 | $60,000 | $281,191 |
| 2022 | $6,273 | $271,766 | $40,000 | $231,766 |
| 2021 | $6,031 | $237,149 | $40,000 | $197,149 |
| 2020 | $5,482 | $215,449 | $40,000 | $175,449 |
| 2019 | $5,490 | $208,488 | $40,000 | $168,488 |
| 2018 | $4,504 | $191,189 | $40,000 | $151,189 |
| 2017 | $4,715 | $175,254 | $40,000 | $135,254 |
| 2016 | $4,318 | $160,491 | $12,000 | $148,491 |
| 2015 | $3,101 | $127,800 | $12,000 | $115,800 |
| 2014 | $3,101 | $127,800 | $12,000 | $115,800 |
Source: Public Records
Map
Nearby Homes
- 7501 April Ln
- 7717 Reis Ln
- 7513 Chapman Rd
- 7525 Chapman Rd
- 7696 Resting Mews Ln
- 6200 Kings Path
- 6201 Queens Path
- 7500 Regal Ln
- 6321 Little Ranch Rd
- 6737 Bartay Dr
- 7457 N College Cir
- 7233 Romford Way
- 6744 Hewitt St
- 0 Mid Cities Blvd
- 7713 Deaver Dr
- 7609 Deaver Dr
- 6800 Hewitt St
- 7504 Bogart Dr
- 7133 Winchester Rd
- 7400 Bogart Dr
- 7537 Steward Ln
- 7529 Steward Ln
- 7532 Dana Ln
- 7541 Steward Ln
- 7528 Dana Ln
- 7532 Steward Ln
- 7532 Steward Ln
- 7524 Dana Ln
- 7521 Steward Ln
- 7536 Steward Ln
- 7528 Steward Ln
- 7540 Steward Ln
- 7524 Steward Ln
- 7520 Dana Ln
- 7517 Steward Ln
- 7544 Steward Ln
- 7601 Doris Ct
- 7520 Steward Ln
- 7516 Dana Ln
- 7604 Teresa Ct