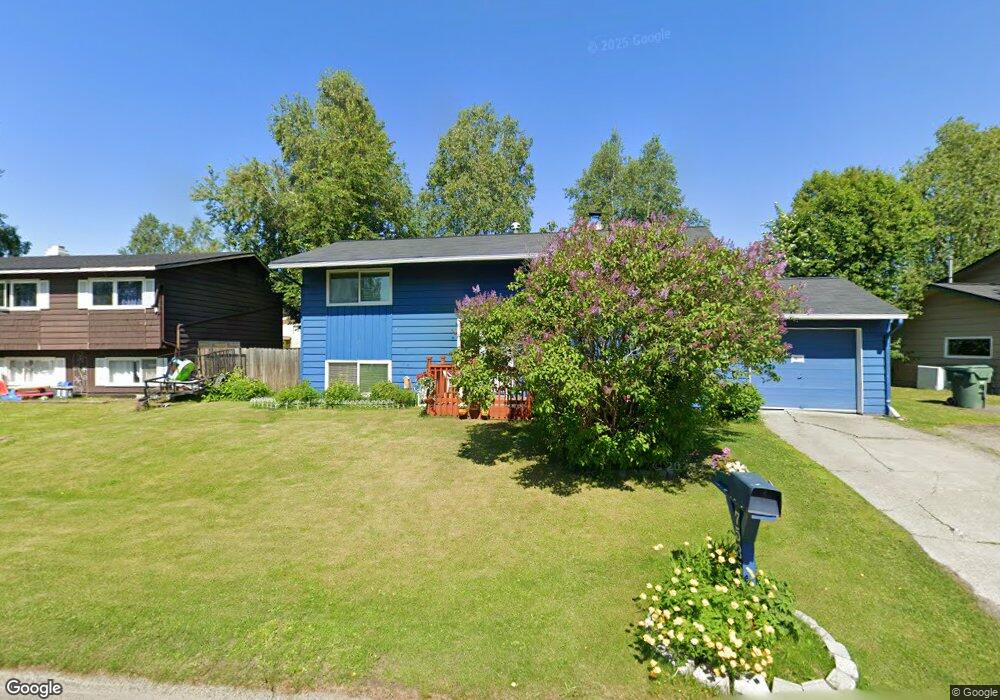
7535 Island Dr Anchorage, AK 99504
Northeast Anchorage NeighborhoodEstimated Value: $227,000 - $395,000
4
Beds
2
Baths
1,824
Sq Ft
$175/Sq Ft
Est. Value
About This Home
This home is located at 7535 Island Dr, Anchorage, AK 99504 and is currently estimated at $318,341, approximately $174 per square foot. 7535 Island Dr is a home located in Anchorage Municipality with nearby schools including Chester Valley Elementary School, Nicholas J. Begich Middle School, and Bartlett High School.
Ownership History
Date
Name
Owned For
Owner Type
Purchase Details
Closed on
Oct 3, 2000
Sold by
Johnnie Andrew P and Johnnie Nenita A
Bought by
Johnnie Andrew P and Johnnie Nenita A
Current Estimated Value
Purchase Details
Closed on
Jun 30, 1999
Sold by
Tripp Steven L and Tripp Kimberly D
Bought by
Johnnie Andrew P and Johnnie Nenita A
Home Financials for this Owner
Home Financials are based on the most recent Mortgage that was taken out on this home.
Original Mortgage
$141,780
Outstanding Balance
$37,119
Interest Rate
7.2%
Mortgage Type
New Conventional
Estimated Equity
$281,222
Purchase Details
Closed on
Mar 30, 1994
Sold by
Tripp Steven L
Bought by
Tripp Steven L and Tripp Kimberly D
Home Financials for this Owner
Home Financials are based on the most recent Mortgage that was taken out on this home.
Original Mortgage
$113,338
Interest Rate
7.15%
Mortgage Type
FHA
Create a Home Valuation Report for This Property
The Home Valuation Report is an in-depth analysis detailing your home's value as well as a comparison with similar homes in the area
Home Values in the Area
Average Home Value in this Area
Purchase History
| Date | Buyer | Sale Price | Title Company |
|---|---|---|---|
| Johnnie Andrew P | -- | -- | |
| Johnnie Andrew P | -- | -- | |
| Johnnie Andrew P | -- | -- | |
| Tripp Steven L | -- | -- | |
| Tripp Steven L | -- | -- | |
| Tripp Steven L | -- | -- |
Source: Public Records
Mortgage History
| Date | Status | Borrower | Loan Amount |
|---|---|---|---|
| Open | Johnnie Andrew P | $141,780 | |
| Closed | Johnnie Andrew P | $141,780 | |
| Previous Owner | Tripp Steven L | $113,338 |
Source: Public Records
Tax History Compared to Growth
Tax History
| Year | Tax Paid | Tax Assessment Tax Assessment Total Assessment is a certain percentage of the fair market value that is determined by local assessors to be the total taxable value of land and additions on the property. | Land | Improvement |
|---|---|---|---|---|
| 2025 | $1,640 | $349,300 | $83,500 | $265,800 |
| 2024 | $1,640 | $326,600 | $83,500 | $243,100 |
| 2023 | $5,181 | $304,200 | $83,500 | $220,700 |
| 2022 | $1,622 | $296,300 | $83,500 | $212,800 |
| 2021 | $4,703 | $261,000 | $83,500 | $177,500 |
| 2020 | $886 | $253,300 | $83,500 | $169,800 |
| 2019 | $877 | $253,600 | $83,500 | $170,100 |
| 2018 | $879 | $253,600 | $83,500 | $170,100 |
| 2017 | $1,425 | $261,000 | $83,500 | $177,500 |
| 2016 | $3,330 | $254,100 | $80,400 | $173,700 |
| 2015 | $3,330 | $259,900 | $80,400 | $179,500 |
| 2014 | $3,330 | $243,800 | $76,500 | $167,300 |
Source: Public Records
Map
Nearby Homes
- 1749 Skilak Cir
- 2020 Muldoon Rd Unit 350
- 1900 Muldoon Rd
- 7220 E 20th Ave
- 1749 Brink Dr
- 7831 Wildbrook Ct
- 7120 Chester Ct
- 7110 Foothill Dr
- 1562 State St Unit A2
- 000 Muldoon & Debarr Rd
- 1810 Greendale Dr
- 8111 Northview Dr
- 1542 Northview Dr Unit E5
- 2221 Muldoon Rd Unit 370
- 2221 Muldoon Rd Unit 524
- 2558 Brookshire Loop Unit 32
- 1450 Northview Dr Unit J6
- 1414 Marten St
- 6911 Mink Ave
- 2441 Scarborough Dr
- 7531 Island Dr
- 7545 Island Dr
- 7530 Beluga Cir
- 7540 Beluga Cir
- 7540 Beluga Cir Unit 99504
- 7553 Island Dr
- 7527 Island Dr
- 7536 Island Dr
- 7546 Island Dr
- 7546 Island Dr Unit 45
- 7510 Beluga Cir
- 7552 Island Dr
- 7557 Island Dr
- 7519 Island Dr
- 7550 Beluga Cir
- 7528 Island Dr
- 1917 Kulik Cir
- 7529 Beluga Cir
- 7519 Beluga Cir
- 7520 Island Dr