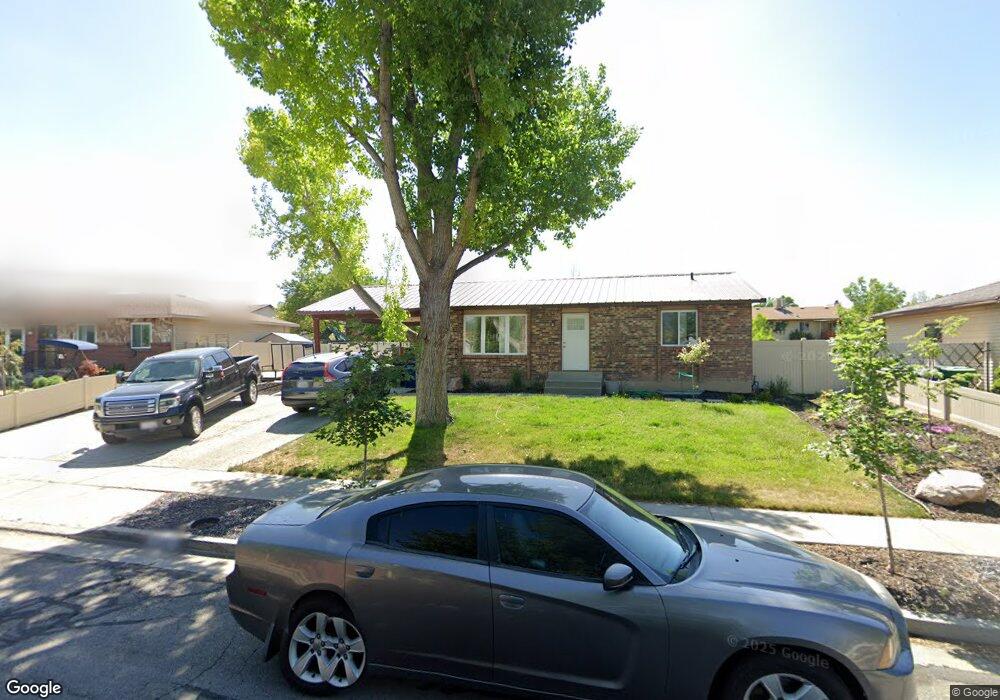
7536 S Springbrook Dr West Jordan, UT 84084
Estimated Value: $440,000 - $469,462
4
Beds
2
Baths
2,016
Sq Ft
$229/Sq Ft
Est. Value
About This Home
This home is located at 7536 S Springbrook Dr, West Jordan, UT 84084 and is currently estimated at $461,116, approximately $228 per square foot. 7536 S Springbrook Dr is a home located in Salt Lake County with nearby schools including Oquirrh Elementary School, Joel P. Jensen Middle School, and West Jordan High School.
Ownership History
Date
Name
Owned For
Owner Type
Purchase Details
Closed on
Nov 3, 2020
Sold by
Waller Dakota Ann and Waller John Brian
Bought by
Waller Dakota Ann and Waller John Brian
Current Estimated Value
Home Financials for this Owner
Home Financials are based on the most recent Mortgage that was taken out on this home.
Original Mortgage
$215,400
Outstanding Balance
$192,019
Interest Rate
2.9%
Mortgage Type
New Conventional
Estimated Equity
$269,097
Purchase Details
Closed on
Mar 24, 2017
Sold by
Marelko 8 Llc
Bought by
Saunders Dakota Ann and Waller John Brian
Home Financials for this Owner
Home Financials are based on the most recent Mortgage that was taken out on this home.
Original Mortgage
$217,979
Interest Rate
4.37%
Mortgage Type
FHA
Purchase Details
Closed on
Jul 19, 2013
Sold by
Marelko Investments L C
Bought by
Marelko 8 Llc
Purchase Details
Closed on
Oct 16, 2012
Sold by
Whimpey Scott A
Bought by
Marelko Investments Lc
Purchase Details
Closed on
Jul 19, 2007
Sold by
Rh Investment Properties Lp
Bought by
Whimpey Scott A
Purchase Details
Closed on
Jun 6, 2002
Sold by
Chavez Frank and Chavez Anne
Bought by
Haugen Randy and Haugen Valerie
Create a Home Valuation Report for This Property
The Home Valuation Report is an in-depth analysis detailing your home's value as well as a comparison with similar homes in the area
Home Values in the Area
Average Home Value in this Area
Purchase History
| Date | Buyer | Sale Price | Title Company |
|---|---|---|---|
| Waller Dakota Ann | -- | Legends Title Llc | |
| Saunders Dakota Ann | -- | Vanguard Title | |
| Marelko 8 Llc | -- | None Available | |
| Marelko Investments Lc | -- | Mountain View Title & Escrow | |
| Whimpey Scott A | -- | Accommodation | |
| Haugen Randy | $97,750 | -- |
Source: Public Records
Mortgage History
| Date | Status | Borrower | Loan Amount |
|---|---|---|---|
| Open | Waller Dakota Ann | $215,400 | |
| Closed | Saunders Dakota Ann | $217,979 |
Source: Public Records
Tax History Compared to Growth
Tax History
| Year | Tax Paid | Tax Assessment Tax Assessment Total Assessment is a certain percentage of the fair market value that is determined by local assessors to be the total taxable value of land and additions on the property. | Land | Improvement |
|---|---|---|---|---|
| 2025 | $2,147 | $429,800 | $119,600 | $310,200 |
| 2024 | $2,147 | $413,000 | $115,700 | $297,300 |
| 2023 | $2,141 | $388,200 | $111,200 | $277,000 |
| 2022 | $2,053 | $366,300 | $109,000 | $257,300 |
| 2021 | $1,721 | $279,500 | $86,300 | $193,200 |
| 2020 | $1,604 | $244,400 | $80,600 | $163,800 |
| 2019 | $1,613 | $241,100 | $80,600 | $160,500 |
| 2018 | $1,511 | $223,900 | $76,100 | $147,800 |
| 2017 | $1,346 | $198,600 | $76,100 | $122,500 |
| 2016 | $1,312 | $181,900 | $76,100 | $105,800 |
| 2015 | $1,286 | $173,800 | $80,100 | $93,700 |
| 2014 | $1,231 | $163,800 | $76,300 | $87,500 |
Source: Public Records
Map
Nearby Homes
- 7611 S Springbrook Dr
- 3422 Briar Dr
- 3354 W 7800 S
- 7604 S Autumn Dr
- 3165 W 7720 S
- 3476 W Spaulding Rd
- 3629 W 7825 S
- 2886 W 7550 S
- 3066 W Linton Dr
- 3647 W 7865 S
- 3546 W 7980 S
- 7721 Sunset Cir
- 8058 S Lismore Ln Unit 304
- 3332 Lower Newark Way
- 7122 S Wood Green Rd
- 7987 S 2980 W
- 7989 S 3725 W
- 7991 S 3725 W
- 7642 S 2700 W
- 8180 S Old Bingham Hwy
- 7536 Springbrook Dr
- 7538 Springbrook Dr
- 7534 Springbrook Dr
- 7535 S Marylebone Rd
- 7535 Marylebone Rd
- 7533 Marylebone Rd
- 7533 S Marylebone Rd
- 7537 Marylebone Rd
- 7537 S Marylebone Rd
- 3324 W 7545 S
- 7532 S Springbrook Dr
- 7540 Springbrook Dr
- 7540 S Springbrook Dr
- 7532 Springbrook Dr
- 7531 S Marylebone Rd
- 7531 Marylebone Rd
- 7541 Marylebone Rd
- 7541 S Marylebone Rd
- 7535 Springbrook Dr
- 7541 S 3380 St W