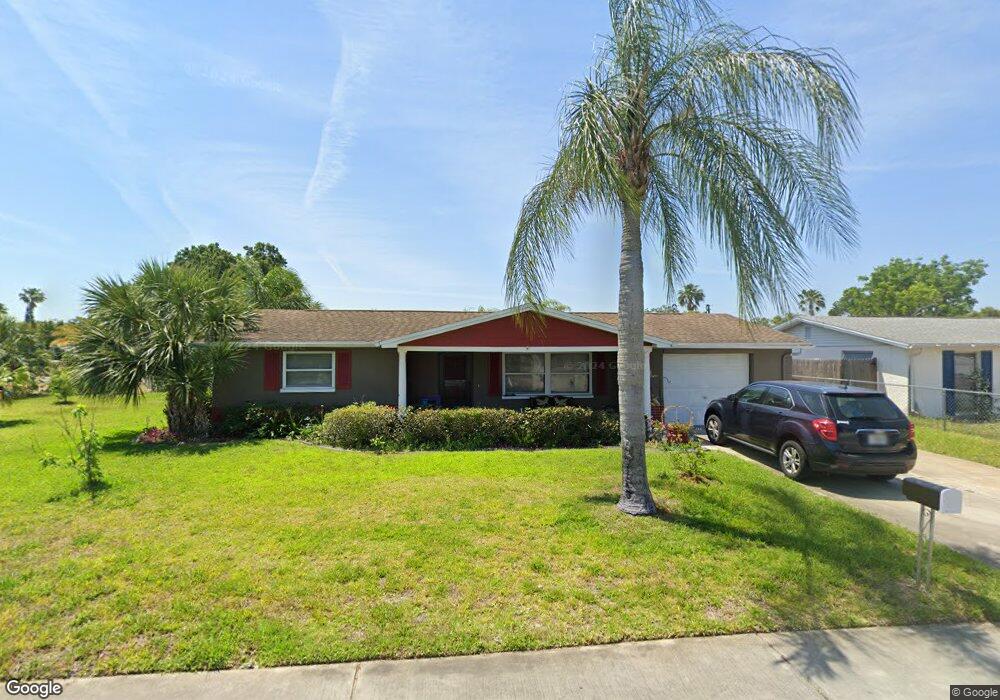
7538 Christina Ln Unit 2 Port Richey, FL 34668
Estimated Value: $218,314 - $246,000
2
Beds
2
Baths
1,308
Sq Ft
$177/Sq Ft
Est. Value
About This Home
This home is located at 7538 Christina Ln Unit 2, Port Richey, FL 34668 and is currently estimated at $232,079, approximately $177 per square foot. 7538 Christina Ln Unit 2 is a home located in Pasco County with nearby schools including Gulf Highlands Elementary School, Bayonet Point Middle School, and Fivay High School.
Ownership History
Date
Name
Owned For
Owner Type
Purchase Details
Closed on
Dec 16, 2016
Sold by
Bice Harold
Bought by
Liverett Charlene L and Cook Deborah
Current Estimated Value
Purchase Details
Closed on
Dec 1, 2016
Bought by
Bice Harold
Purchase Details
Closed on
Jan 7, 2011
Sold by
Citi Property Holdings Inc
Bought by
Bice Harold
Purchase Details
Closed on
Dec 16, 2010
Sold by
Citigroup Global Markets Realty Corp
Bought by
Citi Property Holdings Inc
Purchase Details
Closed on
Sep 29, 2010
Sold by
Grey Mary C and Grey Alan J
Bought by
Citigroup Global Markets Realty Corporat
Purchase Details
Closed on
Oct 23, 2003
Sold by
Folberg Janice E
Bought by
Harris Mary C
Purchase Details
Closed on
Sep 22, 2003
Sold by
Johnson Robert
Bought by
Harris Mary C
Purchase Details
Closed on
Jun 11, 2002
Sold by
Johnson Madge M
Bought by
Johnson Madge M Trust
Create a Home Valuation Report for This Property
The Home Valuation Report is an in-depth analysis detailing your home's value as well as a comparison with similar homes in the area
Home Values in the Area
Average Home Value in this Area
Purchase History
| Date | Buyer | Sale Price | Title Company |
|---|---|---|---|
| Liverett Charlene L | -- | Attorney | |
| Bice Harold | $100 | -- | |
| Bice Harold | $33,000 | Attorney | |
| Citi Property Holdings Inc | -- | Attorney | |
| Citigroup Global Markets Realty Corporat | $25,000 | None Available | |
| Harris Mary C | $69,800 | -- | |
| Harris Mary C | -- | -- | |
| Harris Mary C | -- | -- | |
| Johnson Madge M Trust | -- | -- |
Source: Public Records
Tax History Compared to Growth
Tax History
| Year | Tax Paid | Tax Assessment Tax Assessment Total Assessment is a certain percentage of the fair market value that is determined by local assessors to be the total taxable value of land and additions on the property. | Land | Improvement |
|---|---|---|---|---|
| 2025 | $2,488 | $180,674 | $39,668 | $141,006 |
| 2024 | $2,488 | $183,016 | $39,668 | $143,348 |
| 2023 | $2,424 | $92,860 | $0 | $0 |
| 2022 | $1,877 | $142,633 | $23,888 | $118,745 |
| 2021 | $1,638 | $109,514 | $17,999 | $91,515 |
| 2020 | $1,502 | $98,674 | $8,631 | $90,043 |
| 2019 | $1,405 | $91,479 | $8,631 | $82,848 |
| 2018 | $1,244 | $74,652 | $8,631 | $66,021 |
| 2017 | $1,139 | $63,151 | $8,631 | $54,520 |
| 2016 | $981 | $50,600 | $8,631 | $41,969 |
| 2015 | $904 | $43,332 | $8,631 | $34,701 |
| 2014 | $828 | $40,140 | $8,631 | $31,509 |
Source: Public Records
Map
Nearby Homes
- 7614 Karen Dr
- 7535 Christina Ln
- 11828 Bingham Dr
- 7519 Kensico Dr
- 7719 Salt Ln
- 12041 Hoosier Ct Unit 202
- 12113 Victory Dr
- 7739 Salt Ln
- 12023 Longhorn Dr
- 7721 Hillside Ct Unit 203
- 12133 Spartan Way Unit 204
- 12133 Spartan Way Unit 203
- 12141 Spartan Way Unit 202
- 12141 Spartan Way Unit 102
- 12229 Bear Claw Loop
- 7436 Gulf Highlands Dr
- 12200 Bonanza Dr
- 7911 Bell Dr
- 7901 Marlboro Dr
- 12214 Partridge Hill Row
- 7532 Christina Ln
- 7601 Kensico Dr
- 7537 Kensico Dr
- 7541 Christina Ln
- 7608 Christina Ln
- 7527 Kensico Dr
- 7531 Christina Ln
- 7609 Christina Ln
- 7522 Christina Ln
- 11823 Alpine Pkwy
- 7540 Karen Dr
- 7614 Christina Ln
- 7534 Karen Dr
- 7600 Kensico Dr
- 7523 Kensico Dr
- 7525 Christina Ln Unit 2
- 7536 Kensico Dr
- 11810 Newell Dr
- 7613 Christina Ln
- 7530 Karen Dr Unit 2