Estimated Value: $138,000
5
Beds
2
Baths
2,748
Sq Ft
$50/Sq Ft
Est. Value
About This Home
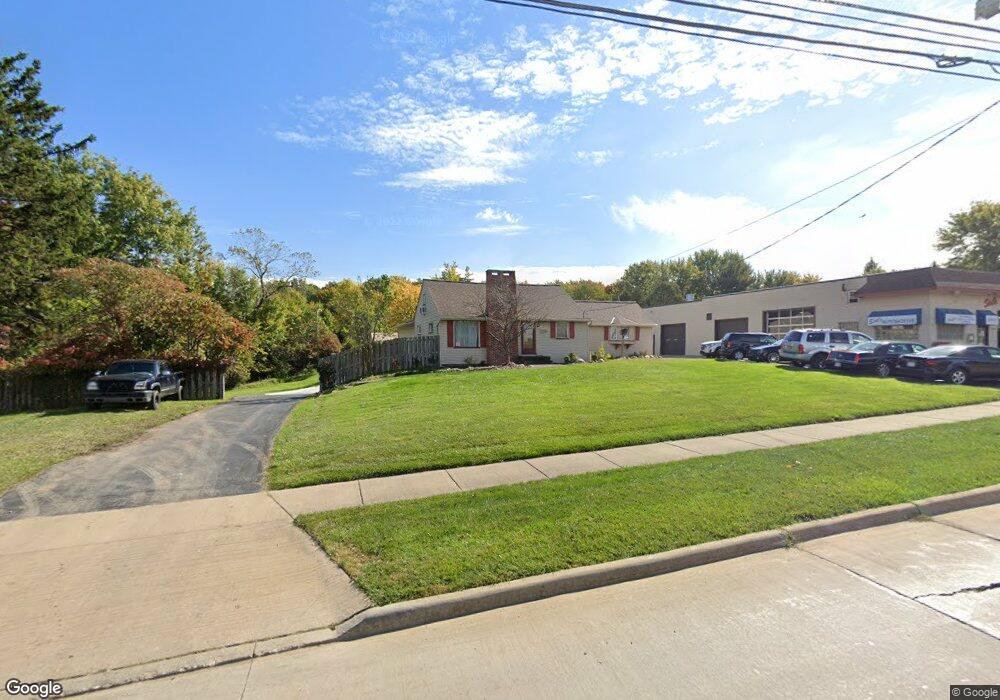
This home is located at 7539 York Rd, Parma, OH 44130 and is currently priced at $138,000, approximately $50 per square foot. 7539 York Rd is a home located in Cuyahoga County with nearby schools including Pleasant Valley Elementary School, Greenbriar Middle School, and Valley Forge High School.
Ownership History
Date
Name
Owned For
Owner Type
Purchase Details
Closed on
Apr 13, 2022
Sold by
Sirl Sr Dale R
Bought by
Shull Family Property Llc
Current Estimated Value
Home Financials for this Owner
Home Financials are based on the most recent Mortgage that was taken out on this home.
Original Mortgage
$100,000
Outstanding Balance
$93,433
Interest Rate
3.76%
Mortgage Type
Seller Take Back
Purchase Details
Closed on
Jul 26, 2017
Sold by
Sirl Dale R and Sirl Susan G
Bought by
Sirl Property Holdings Llc
Purchase Details
Closed on
Feb 13, 1986
Sold by
Sirl Dale R
Bought by
Sirl Dale R
Purchase Details
Closed on
Jan 5, 1982
Sold by
Sirl Dale R and Sirl Sandra M
Bought by
Sirl Dale R
Purchase Details
Closed on
Mar 15, 1978
Sold by
Sirl Norma E
Bought by
Sirl Dale R and Sirl Sandra M
Purchase Details
Closed on
Jan 1, 1975
Bought by
Sirl Norma E
Create a Home Valuation Report for This Property
The Home Valuation Report is an in-depth analysis detailing your home's value as well as a comparison with similar homes in the area
Home Values in the Area
Average Home Value in this Area
Purchase History
| Date | Buyer | Sale Price | Title Company |
|---|---|---|---|
| Shull Family Property Llc | $300,000 | Lazzaro S Robert E | |
| Sirl Property Holdings Llc | -- | None Available | |
| Sirl Dale R | -- | -- | |
| Sirl Dale R | -- | -- | |
| Sirl Dale R | -- | -- | |
| Sirl Norma E | -- | -- |
Source: Public Records
Mortgage History
| Date | Status | Borrower | Loan Amount |
|---|---|---|---|
| Open | Shull Family Property Llc | $100,000 |
Source: Public Records
Tax History Compared to Growth
Tax History
| Year | Tax Paid | Tax Assessment Tax Assessment Total Assessment is a certain percentage of the fair market value that is determined by local assessors to be the total taxable value of land and additions on the property. | Land | Improvement |
|---|---|---|---|---|
| 2024 | $6,071 | $71,155 | $20,300 | $50,855 |
| 2023 | $4,103 | $54,330 | $19,570 | $34,760 |
| 2022 | $4,088 | $54,320 | $19,570 | $34,760 |
| 2021 | $4,958 | $54,320 | $19,570 | $34,760 |
| 2020 | $4,842 | $50,750 | $18,270 | $32,480 |
| 2019 | $4,681 | $145,000 | $52,200 | $92,800 |
| 2018 | $3,557 | $50,750 | $18,270 | $32,480 |
| 2017 | $2,572 | $38,260 | $5,430 | $32,830 |
| 2016 | $2,556 | $38,260 | $5,430 | $32,830 |
| 2015 | $2,411 | $38,260 | $5,430 | $32,830 |
| 2014 | $2,411 | $38,260 | $5,430 | $32,830 |
Source: Public Records
Map
Nearby Homes
- 11339 Gordon Dr
- 9616 W Pleasant Valley Rd
- 10260 Terrace Ct
- 11183 Johnson Dr
- 7706 Wake Robin Dr
- 12220 Zona Ln
- 11000 W Sprague Rd
- 8501 Pin Oak Dr
- 7735 Ann Arbor Dr
- 7032 Brandywine Rd
- 7588 Sleepy Hollow Dr
- 8400 Vista Ln
- 11533 Meadowbrook Dr
- 6996 Greenbriar Dr
- 12614 W Pleasant Valley Rd
- 12720 W Pleasant Valley Rd
- 8414 York Rd
- 7334 Greenleaf Ave
- 9530 Tilby Rd
- 7230 Greenleaf Ave