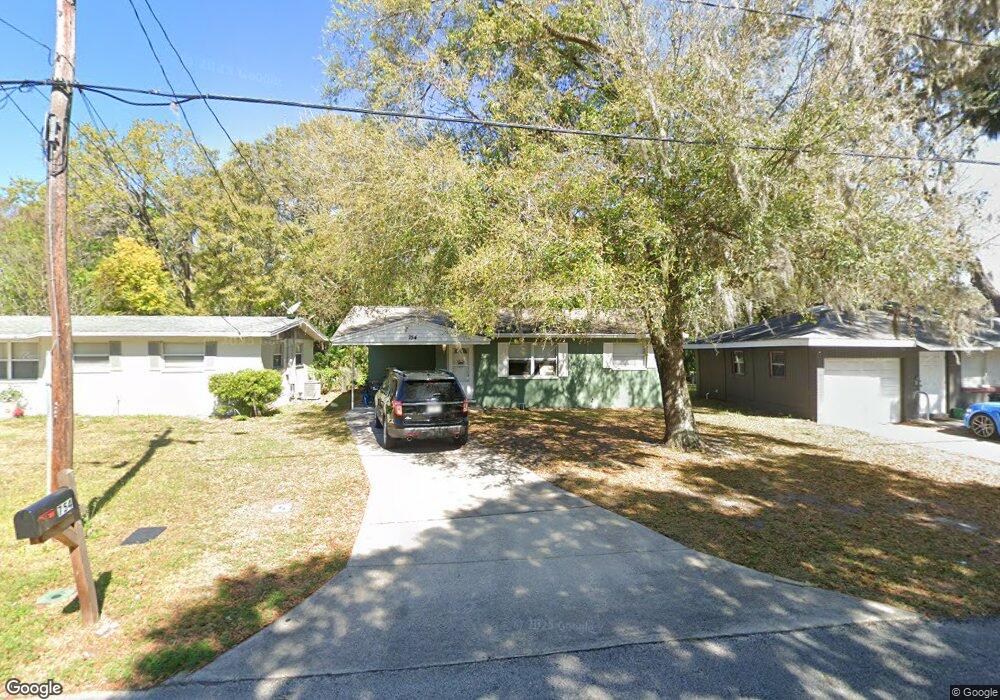
754 Chicago Ave South Daytona, FL 32119
Estimated Value: $154,000 - $246,000
2
Beds
1
Bath
985
Sq Ft
$199/Sq Ft
Est. Value
About This Home
This home is located at 754 Chicago Ave, South Daytona, FL 32119 and is currently estimated at $196,128, approximately $199 per square foot. 754 Chicago Ave is a home located in Volusia County with nearby schools including South Daytona Elementary School, Atlantic High School, and Campbell Middle School.
Ownership History
Date
Name
Owned For
Owner Type
Purchase Details
Closed on
Jul 23, 2014
Sold by
Labosco Lynda M
Bought by
Labosco Lynda M and Lynda M Labosco Revocable Trust
Current Estimated Value
Purchase Details
Closed on
Apr 22, 2005
Sold by
Vanlancker Victor L and Vanlancker Michelle L
Bought by
Labosco Lynda M
Purchase Details
Closed on
Jan 14, 2005
Sold by
Stahlin Elsie M
Bought by
Vanlancker Victor L and Vanlancker Michelle L
Purchase Details
Closed on
Jun 15, 2000
Sold by
Stahlin Walter P and Stahlin Elsie M
Bought by
Stahlin Elsie M
Purchase Details
Closed on
Nov 11, 1994
Sold by
Cissna David Michael and Cissna Peggy Jean
Bought by
Parente Sara S
Purchase Details
Closed on
Sep 15, 1981
Bought by
Labosco Lynda M Tr
Purchase Details
Closed on
May 15, 1980
Bought by
Labosco Lynda M Tr
Create a Home Valuation Report for This Property
The Home Valuation Report is an in-depth analysis detailing your home's value as well as a comparison with similar homes in the area
Home Values in the Area
Average Home Value in this Area
Purchase History
| Date | Buyer | Sale Price | Title Company |
|---|---|---|---|
| Labosco Lynda M | -- | Attorney | |
| Labosco Lynda M | $108,000 | Surfside Title Services Inc | |
| Vanlancker Victor L | $83,000 | Surfside Title Services Inc | |
| Stahlin Elsie M | -- | -- | |
| Parente Sara S | $115,000 | -- | |
| Labosco Lynda M Tr | $36,500 | -- | |
| Labosco Lynda M Tr | $20,000 | -- |
Source: Public Records
Tax History Compared to Growth
Tax History
| Year | Tax Paid | Tax Assessment Tax Assessment Total Assessment is a certain percentage of the fair market value that is determined by local assessors to be the total taxable value of land and additions on the property. | Land | Improvement |
|---|---|---|---|---|
| 2025 | $2,885 | $165,719 | $32,640 | $133,079 |
| 2024 | $2,885 | $188,598 | $32,640 | $155,958 |
| 2023 | $2,885 | $152,539 | $32,640 | $119,899 |
| 2022 | $2,663 | $140,839 | $23,205 | $117,634 |
| 2021 | $2,499 | $120,131 | $20,400 | $99,731 |
| 2020 | $2,301 | $114,135 | $15,300 | $98,835 |
| 2019 | $2,133 | $110,842 | $12,750 | $98,092 |
| 2018 | $1,973 | $101,397 | $11,220 | $90,177 |
| 2017 | $1,838 | $89,488 | $9,482 | $80,006 |
| 2016 | $1,745 | $88,302 | $0 | $0 |
| 2015 | $1,618 | $76,873 | $0 | $0 |
| 2014 | $1,456 | $66,091 | $0 | $0 |
Source: Public Records
Map
Nearby Homes
- 1610 Magnolia Ave
- 1436 Mardrake Rd
- 713 Beville Rd
- 1425 Margina Ave
- 706 Boston Ave
- 1421 Margina Ave
- 1425 Peachtree Rd
- 1412 Margina Ave
- 1425 Suwanee Rd
- 1724 Western Rd
- 1703 Magnolia Ave Unit 11
- 1970 Red Cedar Cir
- 1810 Western Rd
- 1951 Red Cedar Cir
- 1642 Caldwell Rd
- 1393 Sunland Rd
- 1975 Red Cedar Cir
- 1317 Margina Ave
- 1743 Jacobs Rd
- 1312 Mardrake Rd
- 746 Chicago Ave
- 760 Chicago Ave
- 744 Chicago Ave
- 802 Chicago Ave
- 753 New York Ave
- 801 New York Ave
- 751 New York Ave
- 799 Chicago Ave
- 745 Chicago Ave
- 749 New York Ave
- 740 Chicago Ave
- 803 New York Ave
- 801 Chicago Ave
- 741 Chicago Ave
- 806 Chicago Ave
- 803 Chicago Ave
- 805 New York Ave
- 738 Chicago Ave
- 815 Chicago Ave
- 809 New York Ave