754 E Fallbrook St Fallbrook, CA 92028
Estimated Value: $695,000 - $775,108
About This Home
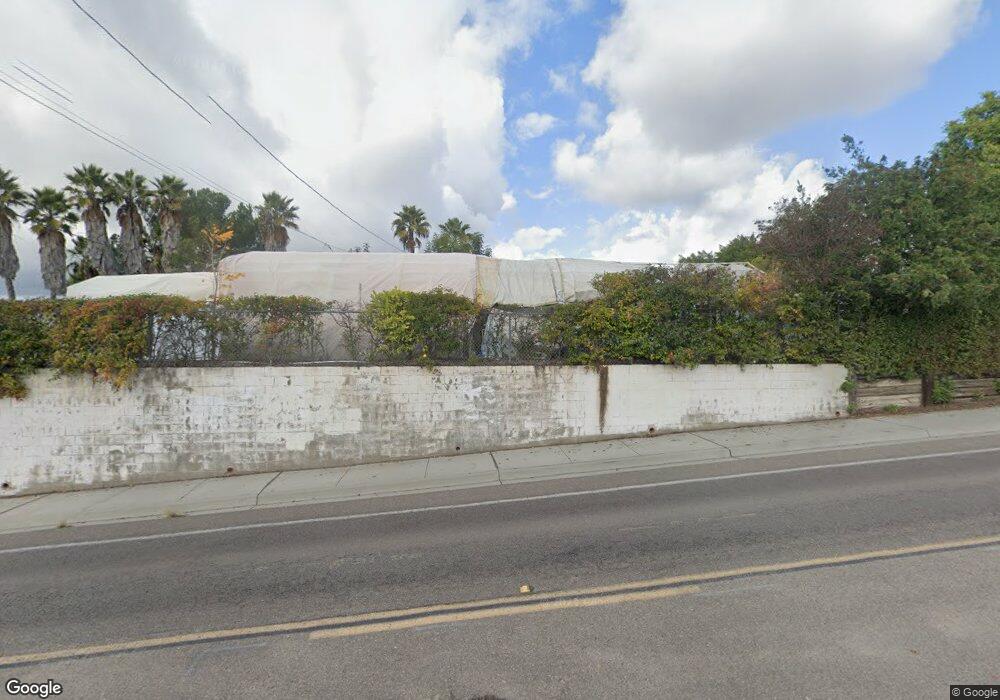
This home is located at 754 E Fallbrook St, Fallbrook, CA 92028 and is currently estimated at $734,277, approximately $451 per square foot. 754 E Fallbrook St is a home located in San Diego County with nearby schools including La Paloma Elementary School, James E. Potter Intermediate School, and Fallbrook High School.
Ownership History
We collect this data history from publicly available records. To have your information removed, we recommend requesting removal directly through your county’s website.
Purchase Details
Purchase Details
Purchase Details
Home Values in the Area
Average Home Value in this Area
Purchase History
We collect this data history from publicly available records. To have your information removed, we recommend requesting removal directly through your county’s website.
| Date | Buyer | Sale Price | Title Company |
|---|---|---|---|
| -- | None Available | ||
| $150,000 | -- | ||
| $106,000 | -- |
Tax History
We collect this data history from publicly available records. To have your information removed, we recommend requesting removal directly through your county’s website.
| Year | Tax Paid | Tax Assessment Tax Assessment Total Assessment is a certain percentage of the fair market value that is determined by local assessors to be the total taxable value of land and additions on the property. | Land | Improvement |
|---|---|---|---|---|
| 2025 | $2,872 | $278,658 | $176,823 | $101,835 |
| 2024 | $2,872 | $273,195 | $173,356 | $99,839 |
| 2023 | $2,792 | $267,839 | $169,957 | $97,882 |
| 2022 | $2,792 | $262,588 | $166,625 | $95,963 |
| 2021 | $2,697 | $257,440 | $163,358 | $94,082 |
| 2020 | $2,717 | $254,801 | $161,683 | $93,118 |
| 2019 | $2,662 | $249,806 | $158,513 | $91,293 |
| 2018 | $2,620 | $244,908 | $155,405 | $89,503 |
| 2017 | $750 | $240,107 | $152,358 | $87,749 |
| 2016 | $2,501 | $235,400 | $149,371 | $86,029 |
| 2015 | $2,461 | $231,865 | $147,128 | $84,737 |
| 2014 | $2,413 | $227,324 | $144,246 | $83,078 |
Map
- 1032 Felicidad Dr
- 308 Retreat Ct
- 502 E Elder St
- 177 Barhaven Ln
- 155 Barhaven Ln
- 868 E Alvarado St Unit 28
- 741 Magarian Rd
- 210 S Vine St
- 1003 Via Unidos
- 1113 Crescent Bend
- 0 Via Vonnie Unit SW26054903
- 844 Unit Lot 348
- 1168 N Crescent Ridge Rd
- 1256 E Fallbrook St
- 1086 Snow Creek Rd
- 332 Arroyo Vista
- 346 Arroyo Vista
- 377 Natalie Way
- 431 Debby St
- 915 Cookie Ln
- 555 Potter St
- 737 Driftwood Ln
- 741 Driftwood Ln
- 580 Potter St
- 568 Potter St
- 742 Driftwood Ln
- 717 Driftwood Ln
- 736 Driftwood Ln
- 550 Potter St
- 730 Driftwood Ln
- 724 Driftwood Ln
- 612 Village View Place
- 538 Potter St
- 715 Driftwood Ln
- 521 Potter St
- 595 Shady Glen Dr
- 718 Driftwood Ln
- 585 Shady Glen Dr
- 426 Golden Rd
- 526 Potter St
Ask me questions while you tour the home.