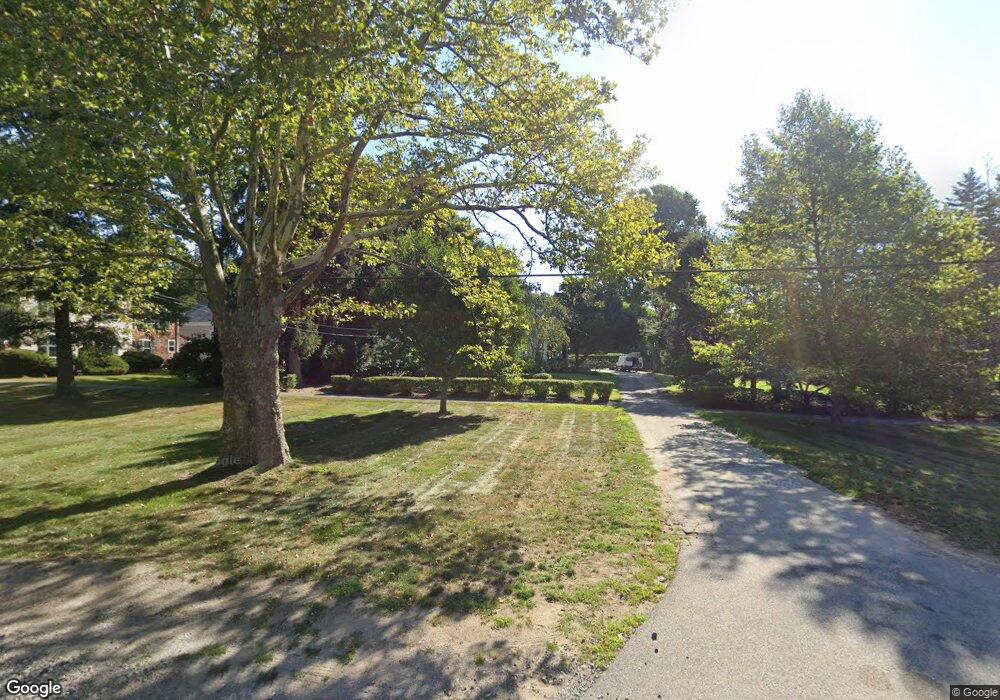
754 Main St Hingham, MA 02043
Estimated Value: $1,756,000 - $2,459,590
5
Beds
5
Baths
3,702
Sq Ft
$555/Sq Ft
Est. Value
About This Home
This home is located at 754 Main St, Hingham, MA 02043 and is currently estimated at $2,054,648, approximately $555 per square foot. 754 Main St is a home located in Plymouth County with nearby schools including South Elementary School, Hingham Middle School, and Hingham High School.
Create a Home Valuation Report for This Property
The Home Valuation Report is an in-depth analysis detailing your home's value as well as a comparison with similar homes in the area
Tax History
| Year | Tax Paid | Tax Assessment Tax Assessment Total Assessment is a certain percentage of the fair market value that is determined by local assessors to be the total taxable value of land and additions on the property. | Land | Improvement |
|---|---|---|---|---|
| 2025 | $22,473 | $2,102,200 | $842,800 | $1,259,400 |
| 2024 | $22,593 | $2,082,300 | $842,800 | $1,239,500 |
| 2023 | $20,546 | $2,054,600 | $842,800 | $1,211,800 |
| 2022 | $19,950 | $1,725,800 | $703,300 | $1,022,500 |
| 2021 | $20,036 | $1,698,000 | $703,300 | $994,700 |
| 2020 | $19,643 | $1,703,600 | $703,300 | $1,000,300 |
| 2019 | $19,977 | $1,691,500 | $703,300 | $988,200 |
| 2018 | $19,674 | $1,671,500 | $703,300 | $968,200 |
| 2017 | $19,573 | $1,597,800 | $690,500 | $907,300 |
| 2016 | $19,559 | $1,566,000 | $658,700 | $907,300 |
| 2015 | $19,500 | $1,556,300 | $649,000 | $907,300 |
Source: Public Records
Map
Nearby Homes
Your Personal Tour Guide
Ask me questions while you tour the home.