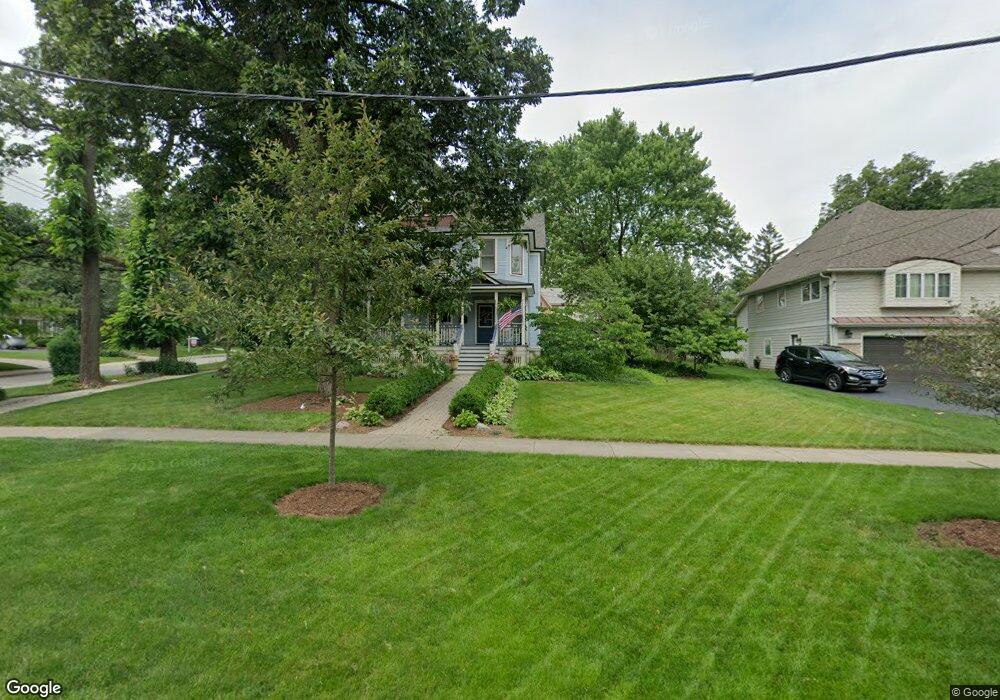
754 N Main St Glen Ellyn, IL 60137
Estimated Value: $791,000 - $1,204,000
4
Beds
3
Baths
2,800
Sq Ft
$354/Sq Ft
Est. Value
About This Home
This home is located at 754 N Main St, Glen Ellyn, IL 60137 and is currently estimated at $990,960, approximately $353 per square foot. 754 N Main St is a home located in DuPage County with nearby schools including Forest Glen Elementary School, Hadley Junior High School, and Glenbard West High School.
Ownership History
Date
Name
Owned For
Owner Type
Purchase Details
Closed on
Dec 8, 1998
Sold by
Harris Bank Palatine
Bought by
Hamilton Troy D and Hamilton Margaret E
Current Estimated Value
Home Financials for this Owner
Home Financials are based on the most recent Mortgage that was taken out on this home.
Original Mortgage
$227,000
Interest Rate
6.96%
Mortgage Type
Balloon
Purchase Details
Closed on
Jan 1, 1995
Sold by
American National Bk & Tr Co Of Chicago
Bought by
Harris Bank Palatine Na
Home Financials for this Owner
Home Financials are based on the most recent Mortgage that was taken out on this home.
Original Mortgage
$254,577
Interest Rate
9.2%
Mortgage Type
Purchase Money Mortgage
Purchase Details
Closed on
Oct 20, 1994
Sold by
Schauer Patrick J
Bought by
Schauer Julie F
Create a Home Valuation Report for This Property
The Home Valuation Report is an in-depth analysis detailing your home's value as well as a comparison with similar homes in the area
Home Values in the Area
Average Home Value in this Area
Purchase History
| Date | Buyer | Sale Price | Title Company |
|---|---|---|---|
| Hamilton Troy D | $365,000 | -- | |
| Harris Bank Palatine Na | -- | Rei Title Services | |
| Schauer Julie F | -- | -- |
Source: Public Records
Mortgage History
| Date | Status | Borrower | Loan Amount |
|---|---|---|---|
| Closed | Hamilton Troy D | $227,000 | |
| Previous Owner | Harris Bank Palatine Na | $254,577 |
Source: Public Records
Tax History
| Year | Tax Paid | Tax Assessment Tax Assessment Total Assessment is a certain percentage of the fair market value that is determined by local assessors to be the total taxable value of land and additions on the property. | Land | Improvement |
|---|---|---|---|---|
| 2024 | $18,401 | $265,571 | $92,062 | $173,509 |
| 2023 | $17,604 | $244,450 | $84,740 | $159,710 |
| 2022 | $16,849 | $231,030 | $80,090 | $150,940 |
| 2021 | $16,209 | $225,550 | $78,190 | $147,360 |
| 2020 | $15,890 | $223,450 | $77,460 | $145,990 |
| 2019 | $15,541 | $217,560 | $75,420 | $142,140 |
| 2018 | $17,006 | $235,650 | $95,700 | $139,950 |
| 2017 | $18,048 | $243,910 | $92,170 | $151,740 |
| 2016 | $18,302 | $234,170 | $88,490 | $145,680 |
| 2015 | $18,275 | $223,400 | $84,420 | $138,980 |
| 2014 | $17,269 | $203,990 | $30,840 | $173,150 |
| 2013 | $16,811 | $204,600 | $30,930 | $173,670 |
Source: Public Records
Map
Nearby Homes
- 580 Oak St
- 540 Elm St
- 28 Muirwood Dr
- 692 Chidester Ave
- 731 Western Ave
- 671 Prairie Ave
- 333 Elm St
- 646 Riford Rd
- 530 Anthony St Unit 530
- 354 Hawthorne Blvd
- 563 Taylor Ave
- 579 Lee St
- 300 Geneva Rd
- 701 Willis St
- 323 Hawthorne Blvd
- 441 N Park Blvd Unit 4B
- 441 N Park Blvd Unit 5K
- 1N450 Highland Ave
- 1N536 Highland Ave
- 861 Crescent Blvd
Your Personal Tour Guide
Ask me questions while you tour the home.